Figure 1.
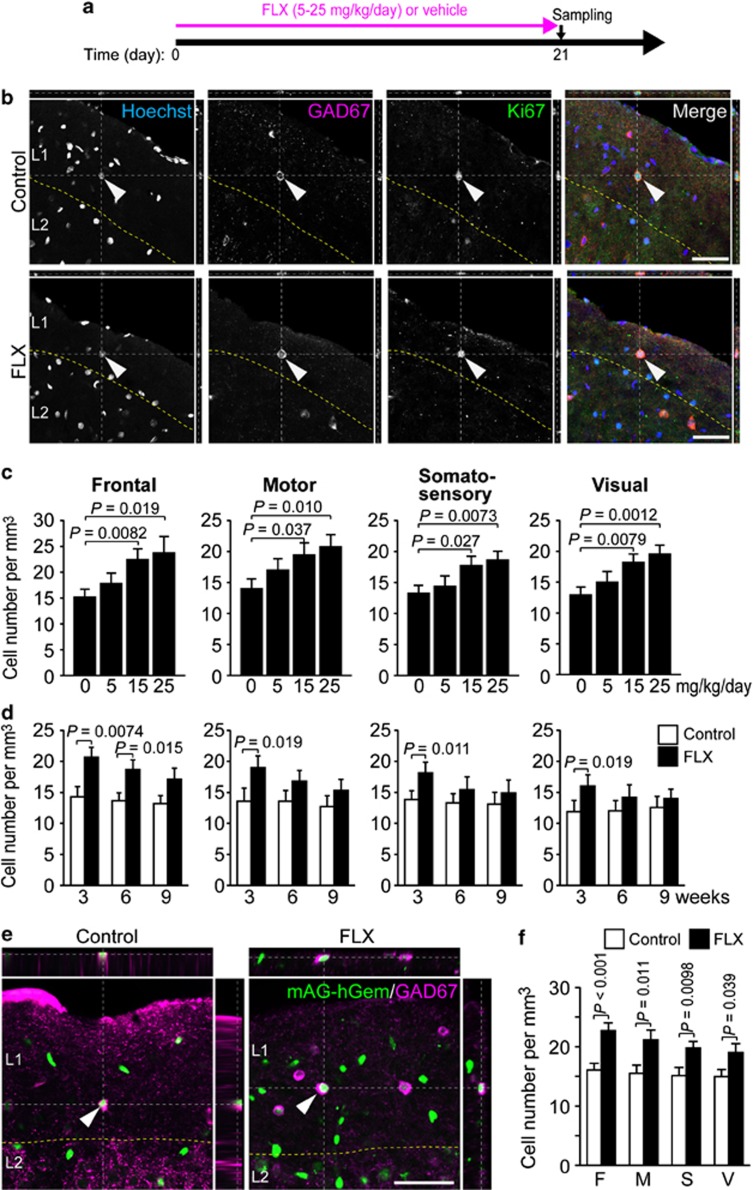
Increase in the number of L1-INP cells by FLX treatment in adult mice. (a) Summary of the time course of experiments. (b) The xy, xz, and yz planes showing co-localization of L1-INP cell markers, GAD67 and Ki67, in control and FLX-treated mice. The arrowheads indicate the same cells in each row. The cell images were taken from the frontal cortex of control (upper row) and FLX-treated mice (lower row) after 3 weeks of FLX treatment (15 mg/kg/day). L, layer. (c) Concentration dependence of L1-INP cells on 3-week FLX treatment (15 mg/kg/day; one-way ANOVA and Tukey's post hoc test, n=5 each). (d) Time-course analysis of the responsiveness of L1-INP cells to FLX (for each time point; Student's or Welch's t tests, n=5 each). Mice were treated with FLX for each period. (e, f) Detection of L1-INP cells in the cortex of adult Fucci transgenic mice and the increase in cell number induced by FLX (Welch's t test, n=6 each). Green signals, which indicate the expression of mAG-hGem, are derived from the Fucci-S/G2/M marker, while the magenta signals indicate GAD67+ structures. L1-INP cells are indicated by arrowheads. Mice were treated with FLX for 3 weeks. F, frontal; M, motor; S, somatosensory; V, visual. All data represent the mean±SEM. Scale bars, 50 μm.

