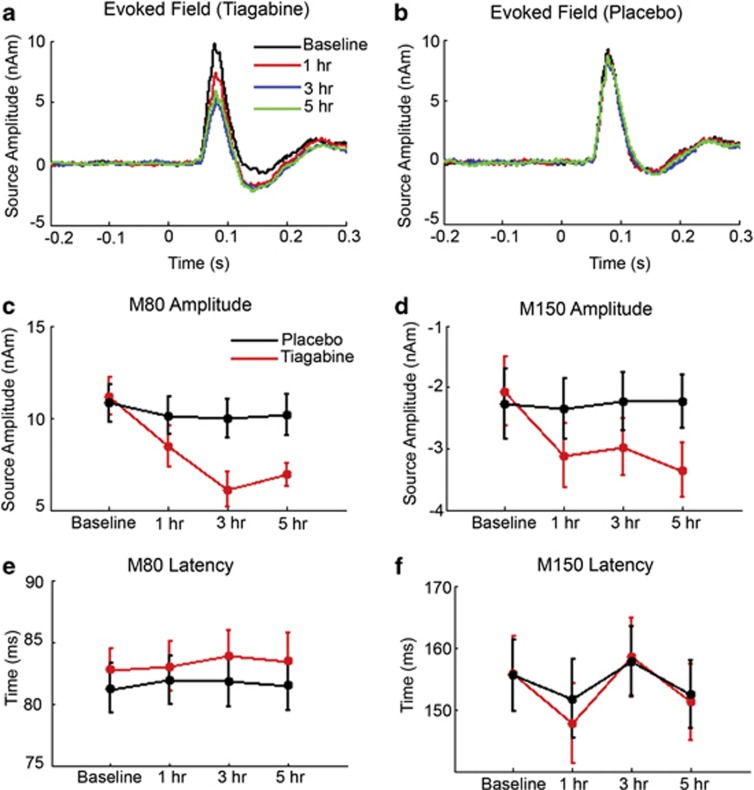
Figure 4.
Source-level evoked field analysis for tiagabine (a) and placebo (b). Extracted M80 and M150 amplitudes are presented in (c) and (d), respectively. Both these parameters showed significant interaction effects; indicating an effect of drug. Note: the negative scaling of (d). The peak latencies of these responses are summarized in (e) and (f), respectively. These did not show significant interaction effects.

