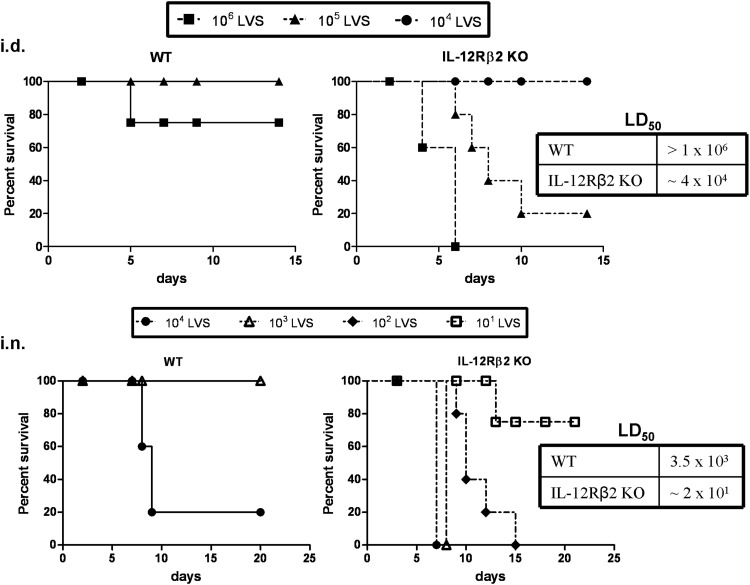
Figure 1. Susceptibility of IL-12Rβ2 KO mice to F. tularensis LVS infection.
Groups of five WT or IL-12Rβ2 KO mice were given 106, 105, or 104 F. tularensis LVS i.d. (upper panels) or 104, 103, 102, or 101 F. tularensis LVS i.n. (lower panels). The dose of infection was confirmed by simultaneous plate counts. The LD50s were calculated for WT and IL-12Rβ2 KO following i.d. or i.n. infections and are displayed in the table next to the graphs. These data are representative of four experiments (i.d.) or three experiments (i.n.) of similar design, in which additional doses of 104 LVS i.d. and 101 and 102 LVS doses i.n. were tested in WT mice, but are not displayed here for clarity. The results are expressed as Kaplan-Meier survival curves, and the data were analyzed using the log-rank test. The median time to death was significantly longer in WT mice infected with LVS 106 i.d. (P≤0.01), LVS 105 i.d. (P≤0.05), LVS 103 i.n. (P≤0.01), and LVS 102 i.n. (P≤0.01) compared with IL-12Rβ2 KO mice.

