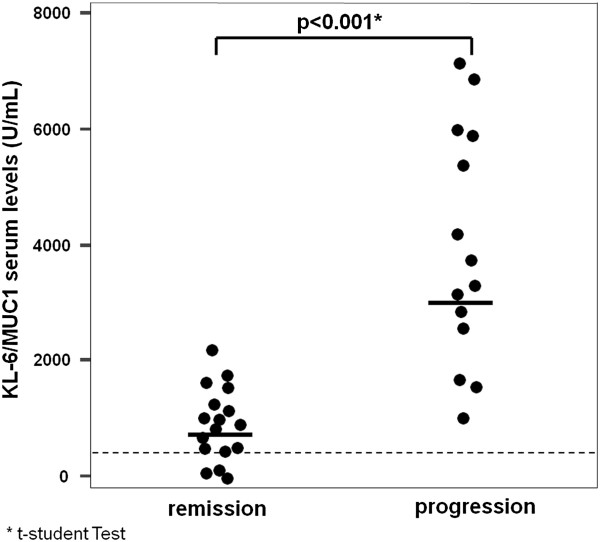
Figure 1.

Initial KL-6 serum levels and disease outcome. The graph shows the initial KL-6 serum concentrations in patients having progression or remission of disease during the follow-up. Dots represent single patients. Grid line represents the upper limit of normal (<458 U/mL). Bold lines represent the mean value.
