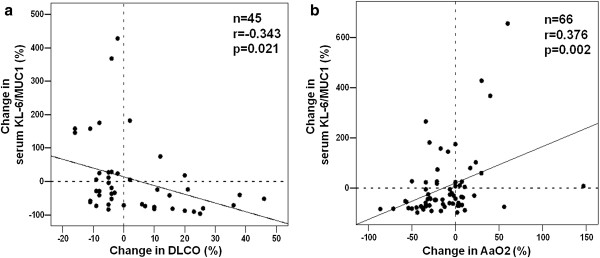
Figure 3.

Correlation between change in KL-6 serum levels and pulmonary diffusing capacity over time. The graph shows the correlation between initial KL-6 serum levels and change in (a) DLCO and (b) A-aDO2 over time. Shown are % values (=relative change from baseline).
