
Figure 3. Sequence-dependent entropy for a number of "artificially sorted" sequences.
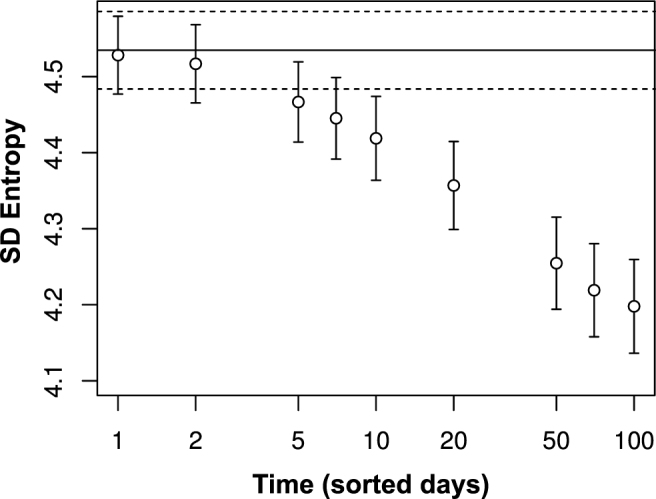
For each window size over which the time series is sorted, we measure the sequence-dependent entropy for the population and estimate the error of the mean. The horizontal solid line at the top of the figure indicates the average SD entropy for the original data whereas the dashed lines depict the band for the error of the mean.