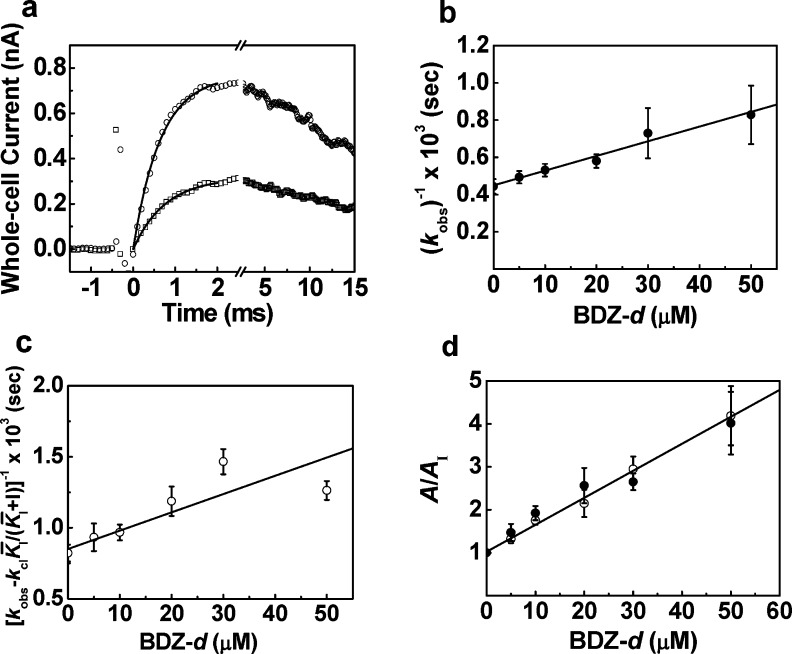
Figure 4.
(a) BDZ-d inhibited both the rate and the amplitude of the opening of the GluA2Qflip channels, shown in the representative whole-cell current traces from an HEK-293 cell obtained from the laser-pulse photolysis experiment. The upper trace (○) was the control (kobs = 2079 s–1; A = 0.74 nA), and the lower trace (□) contained 20 μM BDZ-d (kobs = 1591 s–1; A = 0.38 nA). The concentration of the photolytically released glutamate was estimated to be ∼100 μM in both cases. (b) Effect of BDZ-d on kcl obtained at 100 μM of photolytically released glutamate and as a function of BDZ-d concentration. A K̅I* of 57 ± 5 μM was determined using eq 2. (c) Effect of BDZ-d on kop obtained at 300 μM of photolytically released glutamate and as a function of BDZ-d concentration. A KI* of 66 ± 20 μM was determined using eq 3. (d) Effect of BDZ-d on the whole-cell current amplitude obtained from the laser-pulse photolysis measurement. A KI of 18 ± 2 μM was determined at 100 μM of photolytically released glutamate (●); a KI of 16 ± 1 μM was obtained at 300 μM of photolytically released glutamate (○).

