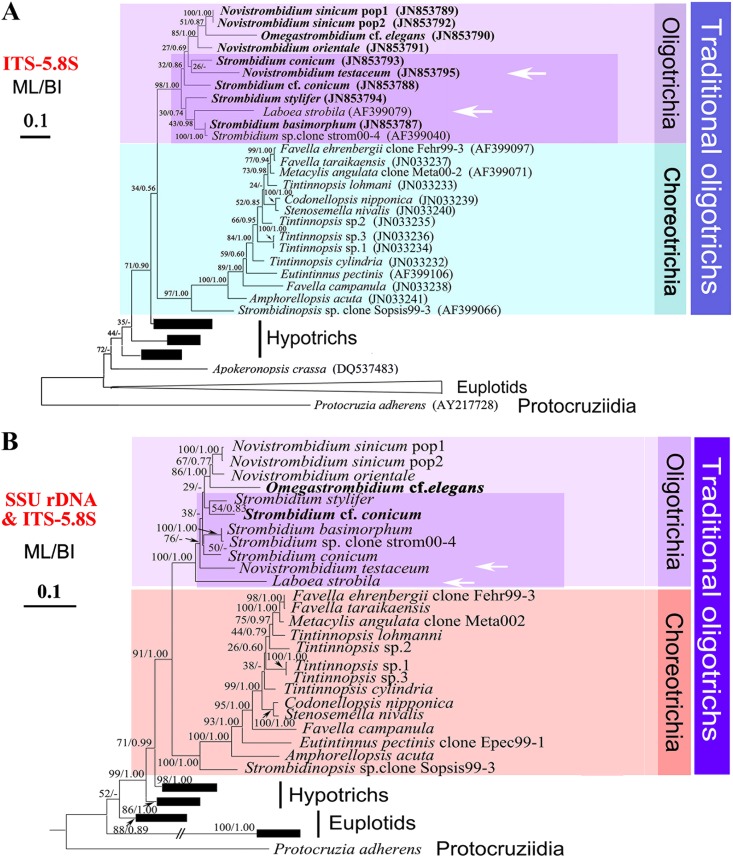
Fig 2.
Phylogenetic trees based on ITS1-5.8S-ITS2 region sequences (A) and SSU rRNA gene and ITS-5.8S region sequences (B) inferred by maximum likelihood (ML) and Bayesian inference (BI) analyses. Species newly sequenced in this study are in boldface. The codes following the names are the GenBank sequence accession numbers. Numbers on branches represent the bootstrap values from ML analysis and posterior probability of Bayesian analysis, respectively. Dashes (-) indicate disagreement between the ML and BI methods. The scale bar corresponds to 10 substitutions per 100 nucleotide positions.

