
Fig 7.
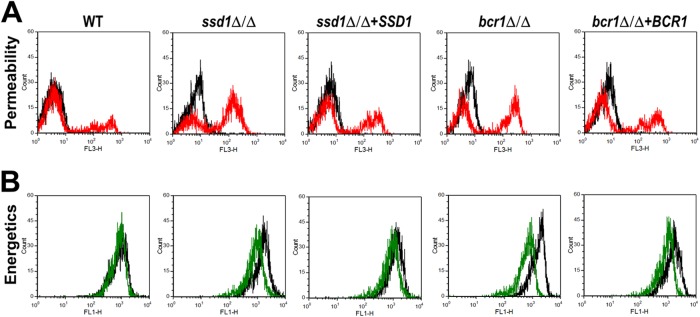
Effects of RP-1 on plasma membrane permeability and mitochondrial membrane potential of the ssd1Δ/Δ and bcr1Δ/Δ mutants. The indicated strains of C. albicans were exposed to 5 μg/ml RP-1 at pH 7.5 for 1 h and then analyzed by flow cytometry. (A) Histogram of propidium iodide fluorescence, a measure of membrane permeabilization. The fluorescence of untreated control cells is indicated by the black lines, and the fluorescence of cells exposed to RP-1 is indicated by the red lines. (B) Histogram of DiOC5 fluorescence, a measure of mitochondrial membrane potential. The fluorescence of untreated control cells is indicated by the black lines, and the fluorescence of cells exposed to RP-1 is indicated by the green lines.