. 2013 Apr 16;2:e00288. doi: 10.7554/eLife.00288

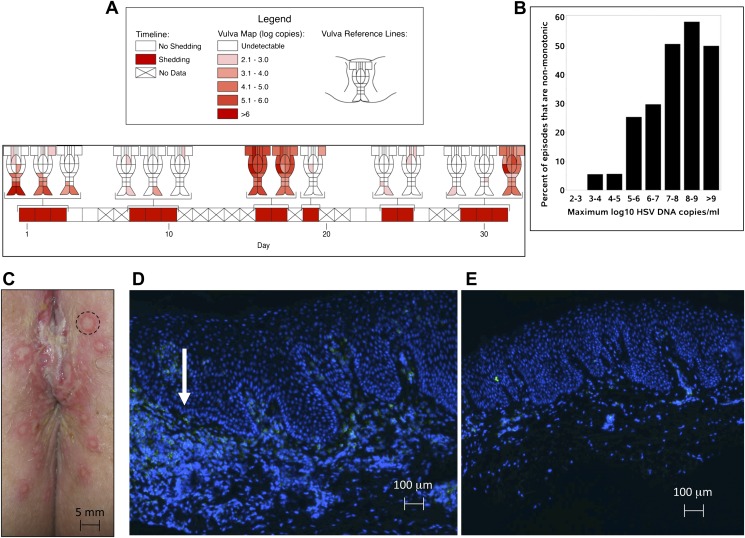
Figure 2. HSV-2 replicates and is contained in widely dispersed microenvironments across the genital tract.

(A) HSV shedding quantity in a participant, who underwent daily swabs in 23 regions across the genital tract for 30 days; days without sampling are marked with an X; stars denote days with a lesion; virus is widely dispersed and several prolonged episodes with heterogeneous viral loads across the genital tract are noted. (B) Increasing probability of episode re-expansion (nonmonotonic episodes) as a function of peak episode copy number among 1020 episodes from 531 study subjects; individual peaks during episodes may represent virus from a single ulcer that can seed other regions. (C) A genital lesion consists of numerous round ulcers (black dotted circle) clustered in space; contemporaneous presence of multiple ulcers may indicate concurrent viral expansion in decay in multiple regions. (D) and (E) Immunofluorescent staining of biopsies performed (D) at the edge, and (E) 1 cm away from an ulcer 3 days post-healing; CD8+ T cells (green) at the dermal–epidermal junction (arrow) are highly localized to ulcer edge (287/mm2) and are fourfold less dense 1 cm away (72/mm2).

DOI: http://dx.doi.org/10.7554/eLife.00288.013

Figure 2—source data 1.
Source data for Figure 2 and Figure 2—figure supplement 1.
elife00288s002.xlsx (36.4KB, xlsx)
DOI: 10.7554/eLife.00288.014

Figure 2.

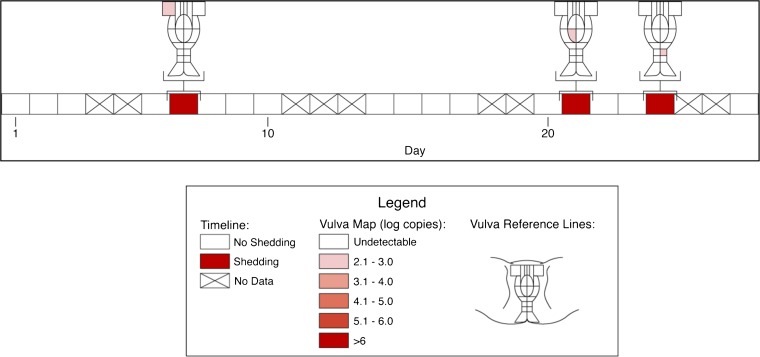
Figure 2—figure supplement 1. Spatial features of HSV genital tract shedding.

Figure 2—figure supplement 1.

HSV shedding quantity in a study participant, who underwent daily swabs in 23 regions across the genital tract for 30 days; days without sampling are marked with an X. The participant had three brief localized episodes with low viral copy number in three separate localized regions.
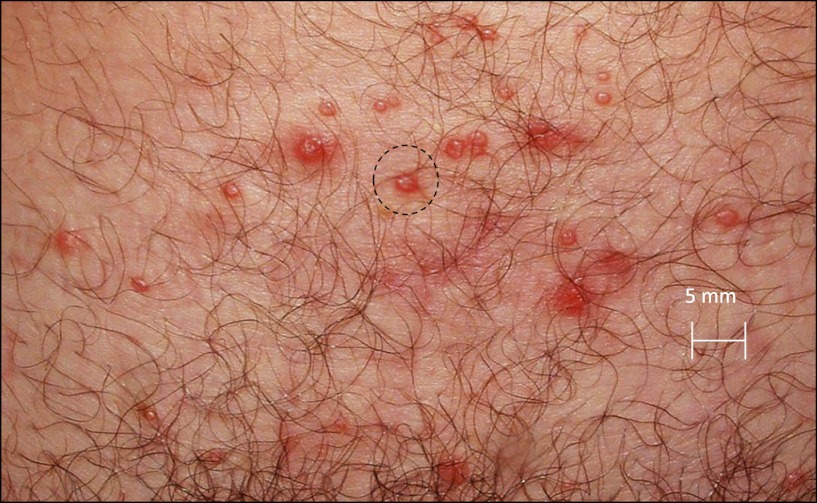
Figure 2—figure supplement 2. Spatial features of HSV-2 lesions.

Figure 2—figure supplement 2.

A genital lesion consists of numerous round ulcers or vesicles (black dotted circle), clustered in space.
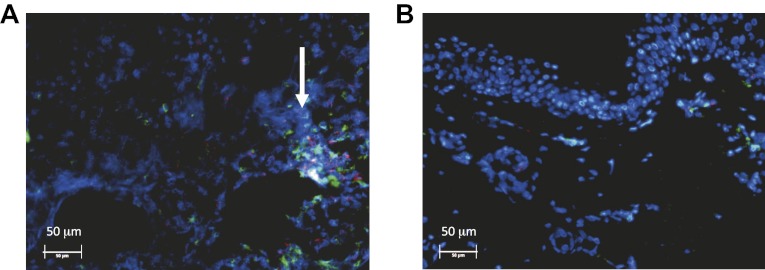
Figure 2—figure supplement 3. Spatial features of CD8+ T-cell response in genital skin.

Figure 2—figure supplement 3.

Immunofluorescent staining of a biopsy performed (A) at the edge, and (B) 1 cm away from an ulcer 3 days post-healing. CD8+ T-cells (red) and CD4+ T-cells (green) at the dermal epidermal junction (arrow) are highly localized to ulcer edge (132/mm2 and 447/mm2, respectively), and are less dense 1 cm away (91/mm2 and 132/mm2, respectively).