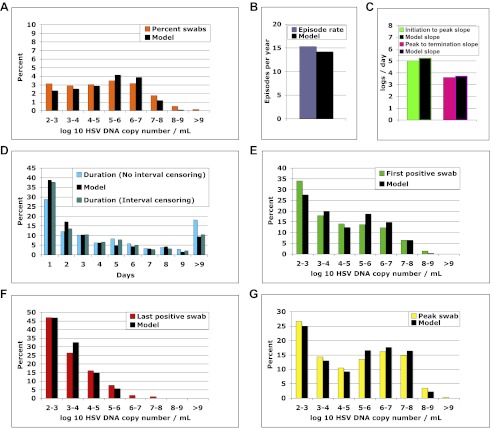
Figure 4. The spatial model reproduces all shedding episode characteristics.
Colored bars represent results from (A) 14,685 genital swabs and (B–G) 1020 shedding episodes from 531 study participants. The model simulation, represented with black bars in each panel, continued until 1020 episodes were generated; model sampling occurred every 24 hr as in the clinical protocol. Model output reproduced (A) quantitative shedding frequency as well as (B) rate, (C) median initiation to peak and peak to termination slopes, (D) Duration, (E) first HSV DNA copy number, (F) last HSV DNA copy number, and (G) peak HSV DNA copy number of episodes.
DOI: http://dx.doi.org/10.7554/eLife.00288.021
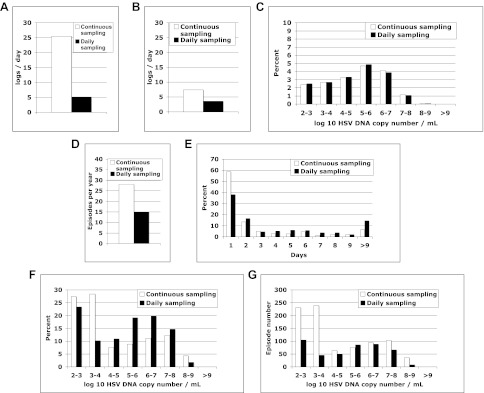
Figure 4—figure supplement 1. Continuous sampling of spatial model output reveals more accurate measures of episode characteristics.


