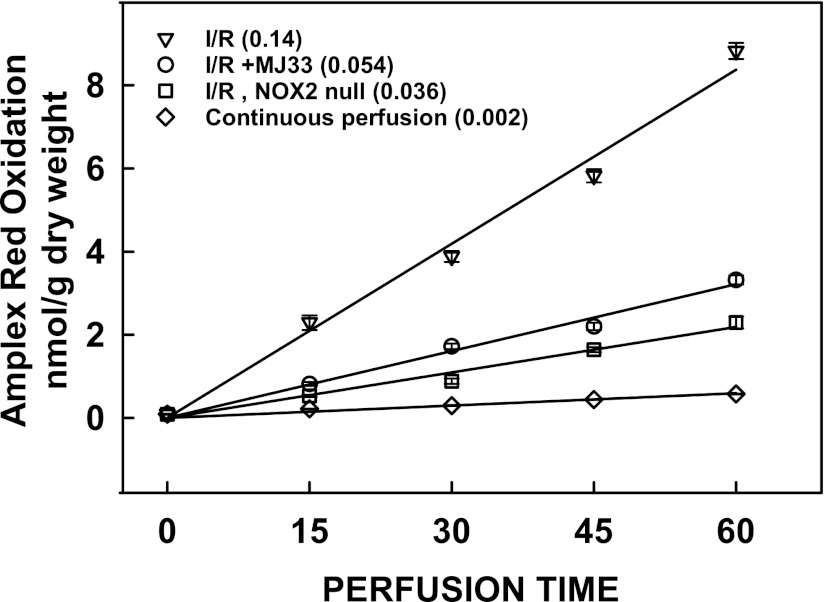
Fig. 7.
ROS production during reperfusion in mouse lungs after 60 min ischemia. ROS production was measured by the Amplex Red method as described in Fig. 1. The dye was added to the perfusate during the 15-minute equilibration period prior to ischemia. A zero reperfusion time perfusate sample was used for background subtraction. Values represent mean ± S.E. for n = 3. The numbers in parentheses indicate the slope of the line (nmol/g dry weight per minute) calculated by least mean squares.

