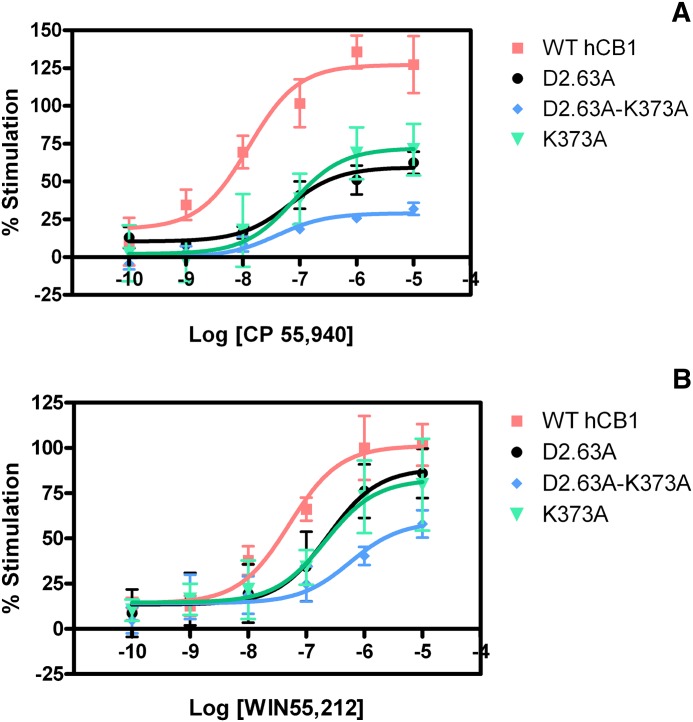
Fig. 4.
Activation of wild-type and mutant receptors. (A) CP55,940. (B) WIN55,212-2. Concentration-effect curves were obtained from [35S]GTPγS binding in HEK293 membrane preparations expressing wild-type or D2.63176A, K373A, or D2.63176A-K373A, D2.63176K-K373D mutant CB1 receptors. Each data point represents the mean ± S.E.M. of at least three independent experiments performed in triplicate.

