
Figure 2.
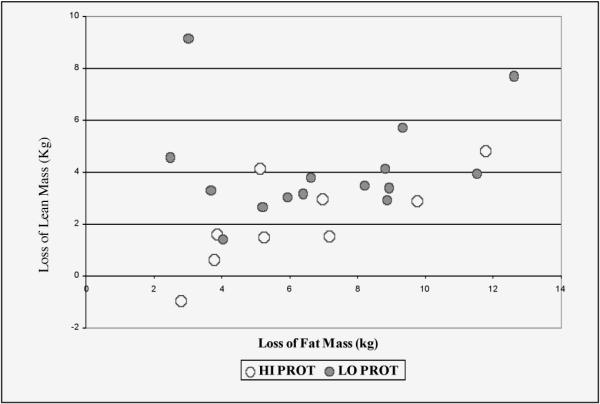
Lean mass loss plotted against fat mass loss for individual participants. Loss of lean (kg) = 0.74 + 0.22*loss of fat (kg) + 1.8 kg if in Low Protein group. Overall F(2,21) = 4.41, p = 0.015; R2 = 0.32. P-value for group effect = 0.03
Official websites use .gov
A
.gov website belongs to an official
government organization in the United States.
Secure .gov websites use HTTPS
A lock (
) or https:// means you've safely
connected to the .gov website. Share sensitive
information only on official, secure websites.
Lean mass loss plotted against fat mass loss for individual participants. Loss of lean (kg) = 0.74 + 0.22*loss of fat (kg) + 1.8 kg if in Low Protein group. Overall F(2,21) = 4.41, p = 0.015; R2 = 0.32. P-value for group effect = 0.03