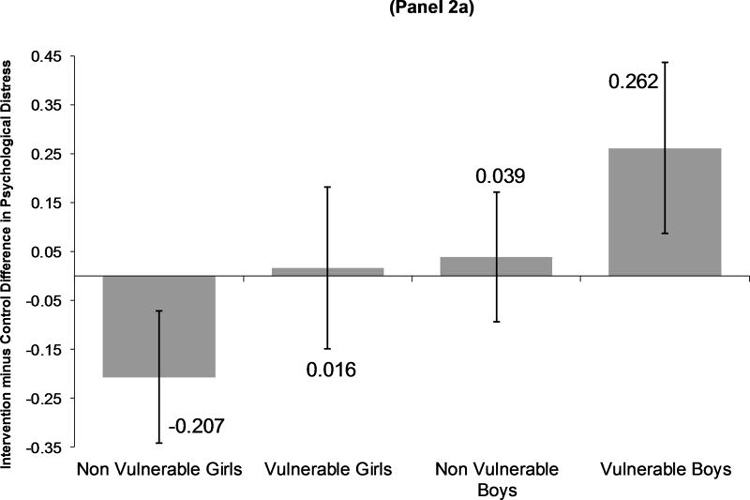
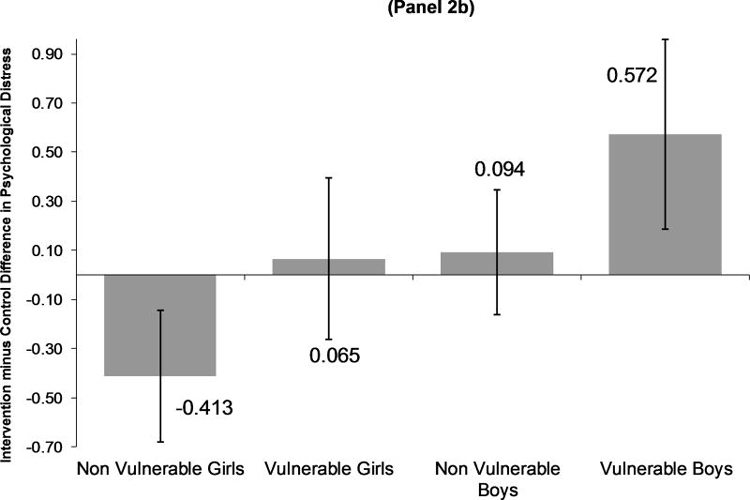
Figure 2. (Panel). MTO Intervention Effects on Mean Difference in Psychological Distress 4–7 Years After Baseline, Modified by Gender & Health Vulnerability.
Panel 2a presents the Linear Regression Intent to Treat (ITT) estimates. Panel 2b presents adherence-adjusted estimates of intervention effects from 2nd stage instrumental variable (IV) analysis. The primary hypothesis test tested whether the intervention-health vulnerability interaction coefficient was significantly different from zero. Intervention-health vulnerability interaction results for ITT: B(SE)=.223(.092), p=.02, CI(.042, .404), and for IV: B(SE)=.478(.192), p=.01, CI(.102, .854). Models adjusted for covariates listed in Table 2, plus intervention-baseline health vulnerability interaction. Subgroup sample size is n=875 for non-vulnerable girls, n=551 for vulnerable girls, n=761 for non-vulnerable boys, and n=642 for vulnerable boys.


