Fig. 5.
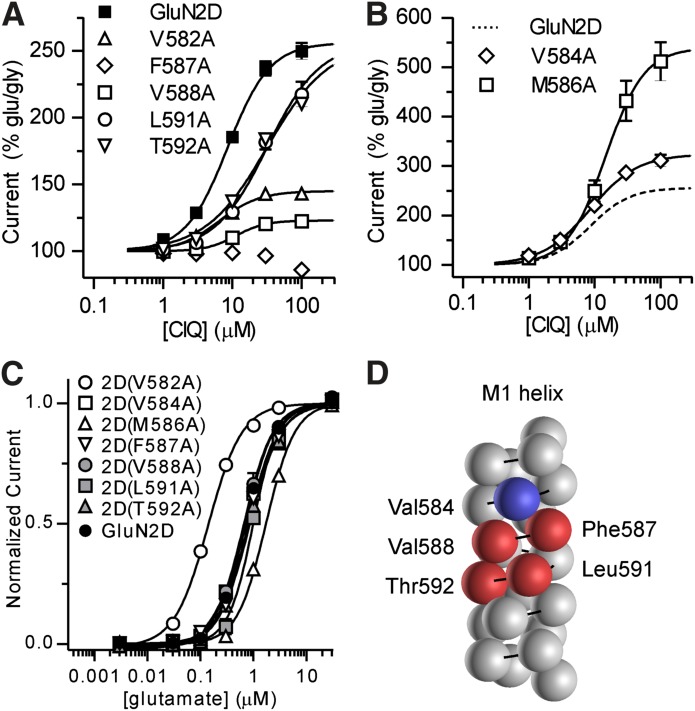
Currents were recorded under two-electrode voltage clamp in response to increasing concentrations of CIQ coapplied with glutamate (100 μM) and glycine (30 μM) to oocytes expressing GluN2D point mutants that attenuated CIQ potentiation (A) or enhanced CIQ potentiation (B). See Table 2 for CIQ EC50 values. Responses were normalized to the currents elicited by glutamate and glycine in the absence of CIQ. Data are from 4–32 oocytes. (C) Glutamate concentration-response curves were measured using two-electrode voltage-clamp recordings of oocytes expressing the GluN2D point mutants from (A) and (B). We coapplied 30 μM glycine with all glutamate concentrations. Glutamate EC50 values (Table 2) measured for 2D(V582A) and 2D(M586A) were significantly different from GluN2D. Data are shown as mean ± S.E.M. from 6–9 oocytes. (D) Residues comprising the M1 helix are depicted as spheres on a generic protein α helix. Residues with diminished CIQ potentiation are colored red and those with increased CIQ potentiation are colored blue. The residues affecting modulation by CIQ but not glutamate potency cluster on one side of the α helix.

