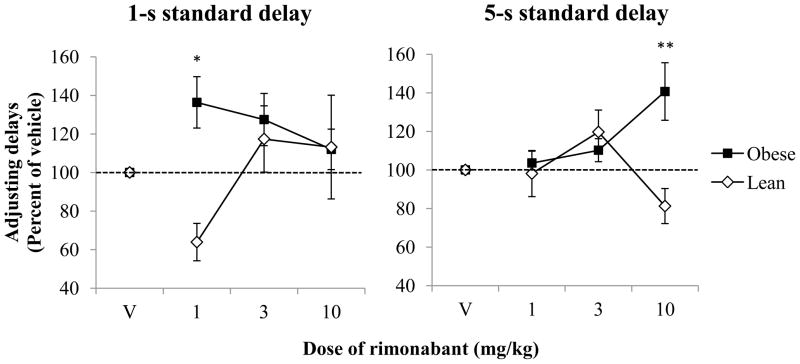
Figure 3.
Adjusting delays expressed as a mean percent of vehicle (±SEM) as a function of dose of rimonabant for lean and obese Zucker rats with the 1-s (left) and 5-s (right) standard delays in the 2-pellet condition. The dotted lines represent 100% of vehicle (i.e., no change in adjusting-delay length). Note that symbols may obstruct error bars in some instances.
*p < 0.05 difference compared to vehicle for both groups
**p < 0.05 difference compared to vehicle for obese rats; p = 0.069 for lean rats

