Figure 1.
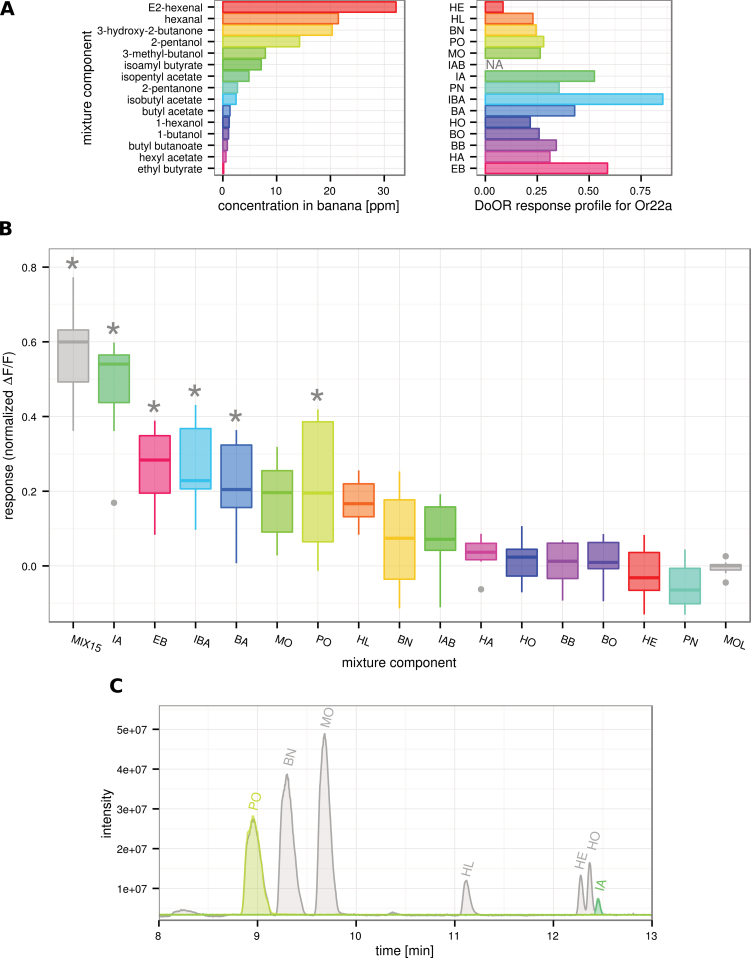
Selected banana compounds tested on dOr22a. A Barplot on the left is showing the concentration in ppm of 15 compounds as they appear in the aromatic profile of banana fruit (Jordán et al. 2001), barplot on the right is giving the corresponding response profile of dOr22a as in the DoOR database (Galizia et al. 2010). B Boxplot showing Ca2+ imaging data recorded on the antenna of Drosophila melanogaster, responses are normalized to ethyl propionate and shifted by mineral oil solvent (MOL) within each animal. Asterisks indicate significant responses compared with solvent MOL (Kruskal–Wallis/Dunn’s multiple comparisons vs. solvent group, P < 0.05, n = 8–9). Five of the components elicited a significant response when given alone. C Sample GC traces for MIX15 (gray), PO and IA. Traces of mixture and single component overlap their respective peaks. For abbreviations and odor concentrations/dilutions see Table 1. Boxplot shows median, lower, and upper quartile, whiskers extend to lowest and highest value that lies within 1.5 times the interquartile range from the box.

