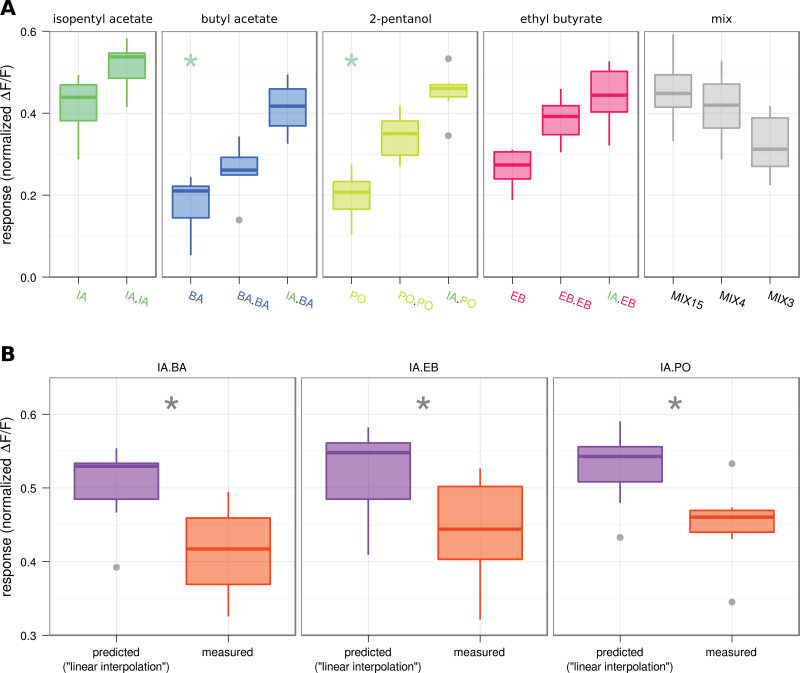
Figure 2.
Binary mixtures with IA. A Boxplot comparing mixture components in single concentration (concentration as from banana profile, left in each panel), double concentration (second plot in each panel), the binary mixtures with IA (third plot in panels 2–4), and responses to different submixtures containing 15, 4, or 3 components (panel 5). No difference could be found between IA and the IA containing binary mixtures or between IA and the different multi component mixtures (MIX15: all 15 tested compounds; MIX4: IA, BA, EB and PO; MIX3: MIX4 without IA) (Kruskal–Wallis/Dunn’s multiple comparisons vs. control group, P < 0.001, n = 7). B Boxplot of responses to binary mixtures as predicted assuming no interactions (“linear interpolation”, purple) and as measured (orange). Prediction and measurement was significantly different in all cases (Wilcoxon Signed Rank Test, P < 0.05, n = 7). Boxplots show median, lower and upper quartile, whiskers extend to lowest and highest values that lie within 1.5 times the interquartile range from the box. This figure appears in color on the online version of this issue.

