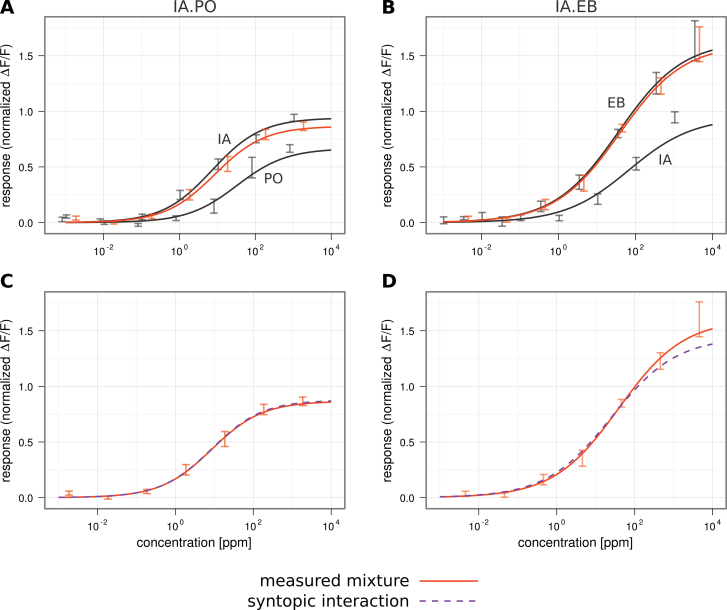
Figure 4.
Dose–response curves for the single odorants IA and PO or EB (dark gray), and the binary mixtures IA.PO (orange) and IA.EB (orange). A and B All dose–response curves can be fitted by the Hill equation. C and D Overlay of the measured mixture responses (orange) and the modeled mixture following syntopic interaction (dashed purple; Rospars et al., 2008). The model is a good estimate of the data. Error bars indicate standard error mean; n = 7. This figure appears in color on the online version of this issue.

