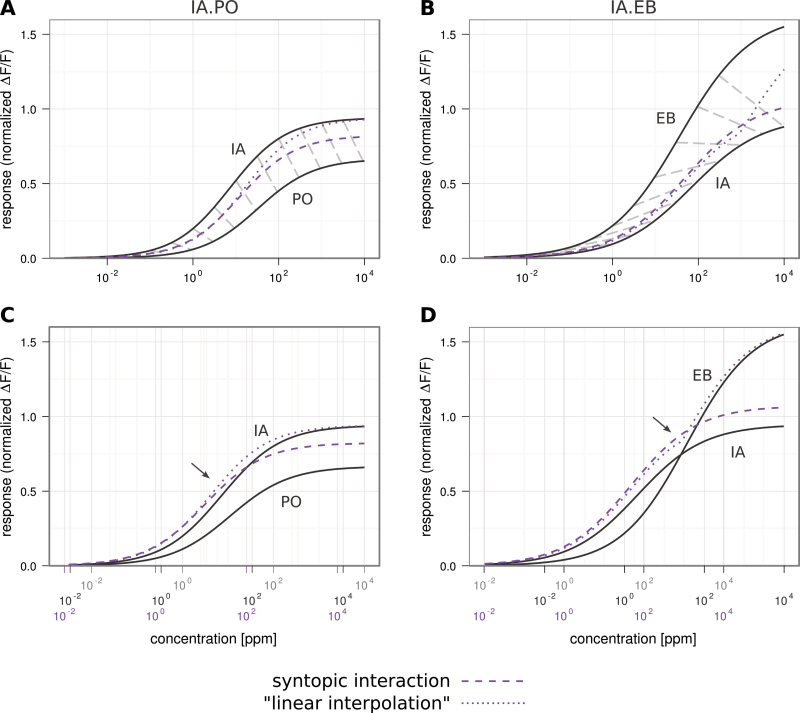
Figure 5.
Mixture dose–response curves estimated for banana ratios. A and B Dark gray curves are the individual components IA and PO or EB, mixture curves in purple show predictions for syntopic interaction (dashed; Rospars et al., 2008) and for “linear interpolation” (dotted; Tabor et al., 2004). Light gray dashed lines in A and B connect corresponding points on the single compound curves according to their ratio in banana scent. C and D Data as in A and B but shifted so that corresponding single concentrations in the “banana ratio” and the resulting mixture are aligned vertically. Note that “linear interpolation” leads to a “kink” in the predicted dose–response curve in B and D. Arrows indicate where syntopic interaction and linear interpolation start to diverge with increasing concentration. This figure appears in color on the online version of this issue.

