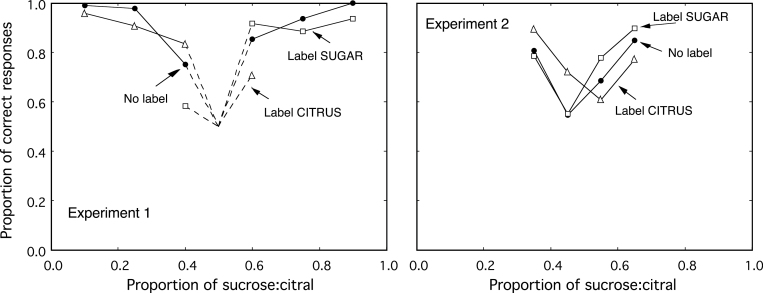
Figure 3.
Proportion of correct responses in the no-label condition (filled circles), label-CITRUS condition (open triangles), and label-SUGAR condition (open squares) of Experiment 1 (left panel) and Experiment 2 (right panel), plotted as a function of the proportion of sucrose to citral. In Experiment 1, 50% of the responses to the stimulus containing a sucrose:citral proportion of 0.5 were treated as correct.

