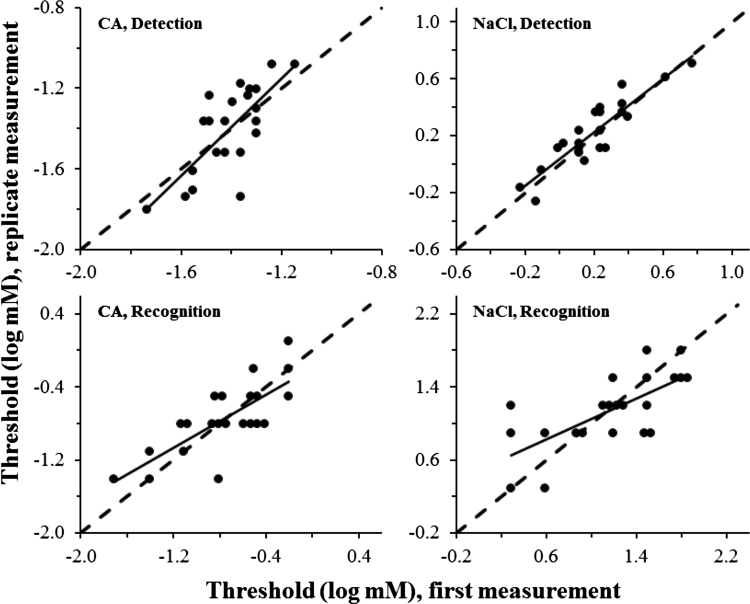
Figure 2 .
Scatter plots illustrating test–retest reliability for a staircase method (detection thresholds) and a modified Harris–Kalmus recognition threshold (HK recognition) for 2 tastants. Dashed lines represent identity (perfect test–retest reliability). Solid lines represent least-squares linear fits. Reliability statistics appear in the text.

