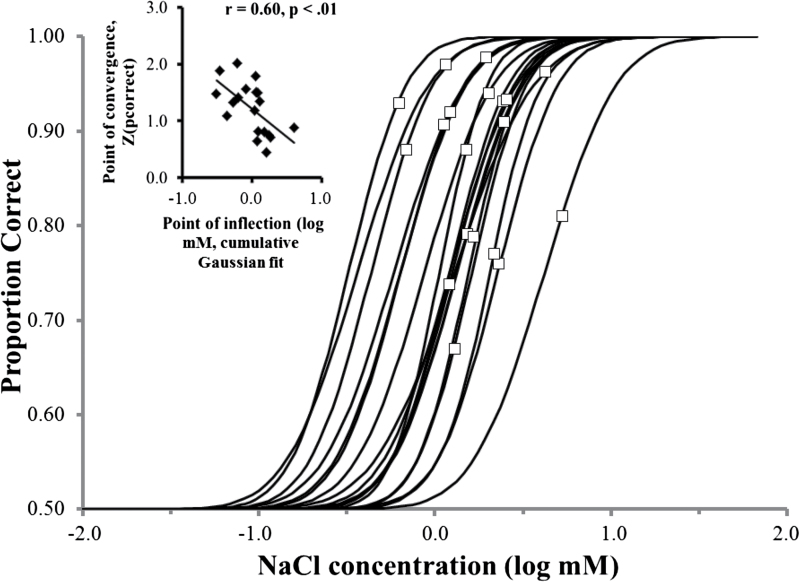
Figure 4 .
Cumulative Gaussian fits for individual subject psychometric functions for NaCl (solid curves). Open squares represent the points on the functions corresponding to average (across 2 sessions) thresholds measured using the modified staircase method for the same subjects. Insert: Normal deviate transform of the proportion correct corresponding to the staircase thresholds versus log of thresholds estimated from psychometric functions (i.e., log of the concentrations corresponding to the points of inflection on the psychometric function).

