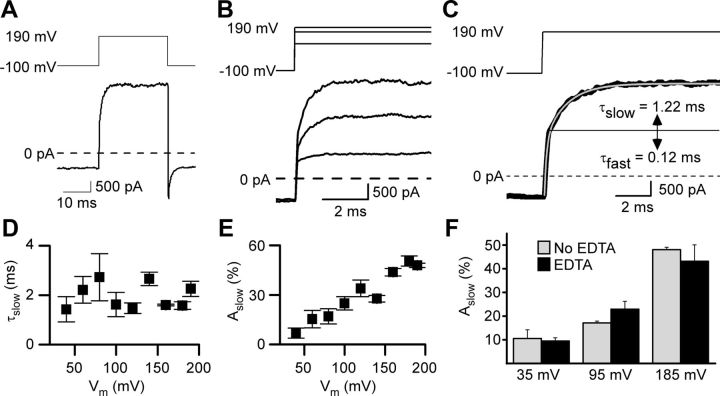
Figure 1.
GluN1/2A receptor current relaxations after depolarizing steps display a slow component in 0 Mgo2+. A, Whole-cell current recording from an HEK 293T cell-expressing GluN1/2A receptors during application of 1 mm glutamate and 10 μm glycine in 0 Mgo2+. After the inward current response (bottom trace) reached a steady-state level, a depolarizing step from −100 to 190 mV (top trace) was applied. Leak and capacitive currents were subtracted in all figures. B, Voltage steps (top traces) and current responses (bottom traces) from the cell used for A with expanded time base during depolarizations from −100 to 80, 160, and 190 mV. C, Voltage step (top trace) and current response (bottom trace, thick line) replotted from A with a double-exponential fit (bottom trace, thin gray line) superimposed. Time constants of fast and slow components of the current relaxation are given; slow component of the current trace appears above the solid horizontal line. D, τslow did not depend significantly on the voltage during the depolarizing step (based on least-squares linear regression, p = 0.80) nor did τfast (p = 0.46; data not shown). E, Aslow as a percentage of the amplitude of the entire current relaxation induced by the depolarizing step increased with depolarization. F, Addition of 10 μm EDTA to normal external solution (No EDTA) did not affect Aslow significantly (p > 0.25 at each voltage; n = 3 for each condition) after depolarizing steps from −105 mV to 35, 95, or 185 mV.

