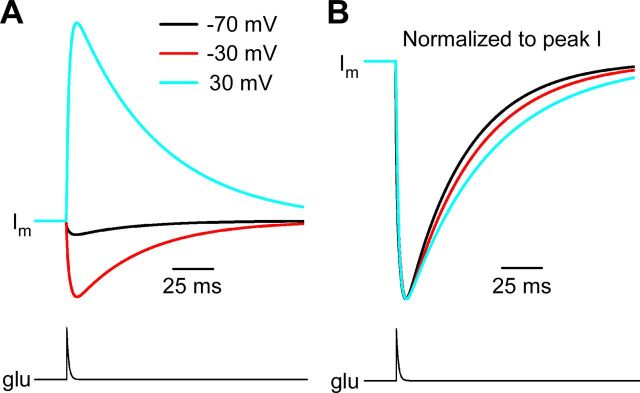
Figure 8.
Voltage-dependent decay kinetics of synaptic currents in 1 mm Mgo2+ simulated by the GluN1/2AV-D model. A, Synaptic currents (top traces) were simulated with the GluN1/2AV-D model in 1 mm Mgo2+ at the indicated membrane voltages by applying a pulse of glutamate (bottom trace) that increased instantaneously from 0 to 1 mm and then decayed with a single-exponential time constant of 1 ms (Clements et al., 1992). B, Simulated synaptic currents were normalized to peak current to allow comparison of decay time course. Decay kinetics became slower with depolarization.

