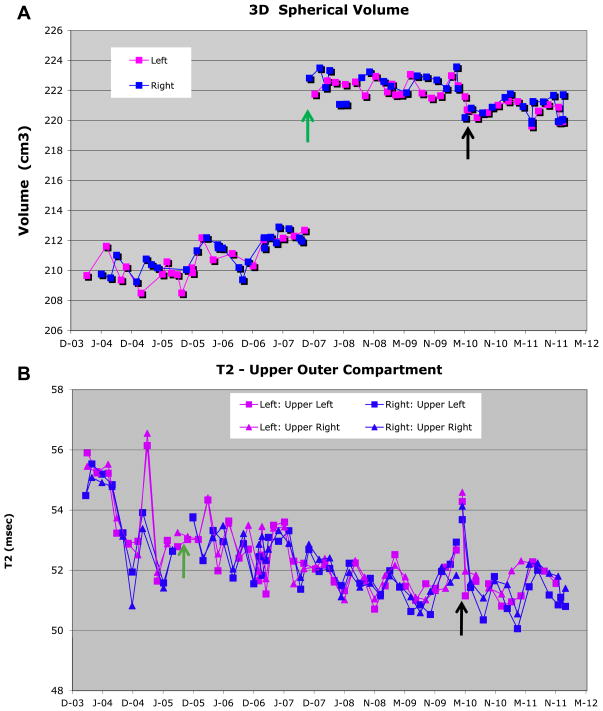
Fig. 2.
Example longitudinal measurements of the OAI phantom (A) 3D spherical volume (site 3) and (B) T2 value (site 1). In (A), the volume for the right (+60 mm off-isocenter; blue square) and left knee (−60 mm off-isocenter; pink square) coil positions are tracked separately to understand the impact of gradient non-linearity. In (B), in addition to tracking the right and left knee coil positions separately, the outer phantom is mathematically divided into are quadrants to understand the impact of RF non-uniformity as well as the interaction between the RF and gradient fields. Thus four separate measurements are available for each the right and left knee coils positions. The top two quadrants are shown for the left knee coil position (upper left quadrant pink square; upper right quadrant pink triangle) and the right knee coil position (upper left quadrant blue square; upper right quadrant blue triangle). Both site 3 (November 2007) and site 1 (September 2005) replaced OAI phantoms (green arrow) during the measurement period. The MR system upgrade (black arrow) for both sites occurred in May 2010. The 5% volume change in (A) was caused by the different phantom. Approximate (original) phantom spherical volume is 210 mm3 (new phantom: 222 mm3) and the outer compartment target T2 value is 50 ms.

