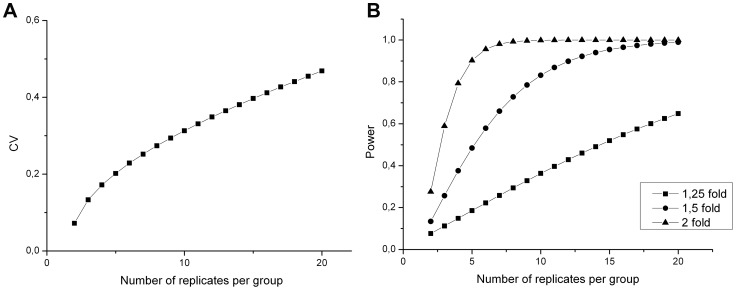
Figure 4. Influence of coefficient of variation.
Panel A shows the influence of coefficient of variation on sample size, assuming a power of 0,8 and a fold change of 1,5. The higher the variation in a setup, the more replicates are needed to obtain the same power. Panel B illustrates power versus number of replicates when detecting various fold changes with following parameters: CV = 30% and a significance level of 0,05. The more subtile changes one wants to observe, the more replicates are required (B).

