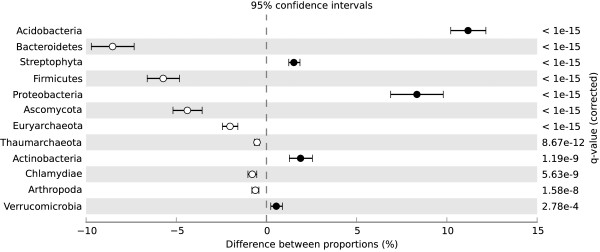
Figure 3.

Significant phylum differences between the +NO3- and –N metagenomes. Results of a Fisher exact test (conducted with the Statistical Analysis of Metagenomic Profiles program) showing the significant differences of environmental gene tag (EGT) matches to phyla between treatments. Higher EGT relative abundance in the +NO3- metagenome have a positive difference between proportions (closed circles), while higher EGT relative abundance in the –N metagenome have a negative difference between proportions (open circles).
