Figure 3.

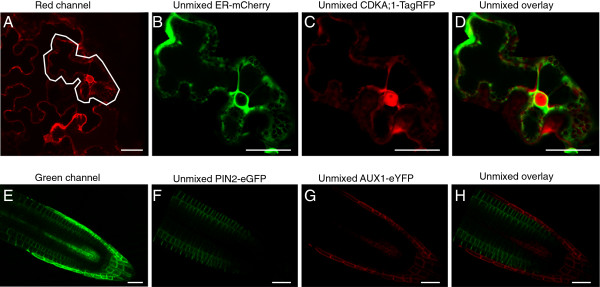
Linear unmixing of spectrally similar fluorophores in tobacco and Arabidopsis cells. (A-D) Tobacco epidermal cells transiently expressing CDKA;1-TagRFP and ER-mCherry marker. (A) Image before unmixing (red channel, 609-619 nm). Fluorophore signals after unmixing: ER-mCherry in the ER strands and nuclear envelope (B) and CDKA;1-TagRFP in the nucleus and the cytoplasm (C). (D) Overlay. (E-H) Arabidopsis roots expressing PIN2-eGFP and AUX1-eYFP. Image before unmixing (green channel, 524-534 nm) (E) and fluorophore signals after unmixing: PIN2-eGFP (G), AUX1-eYFP (F) and overlay (H). Scale bars, 30 μm.
