Figure 6.

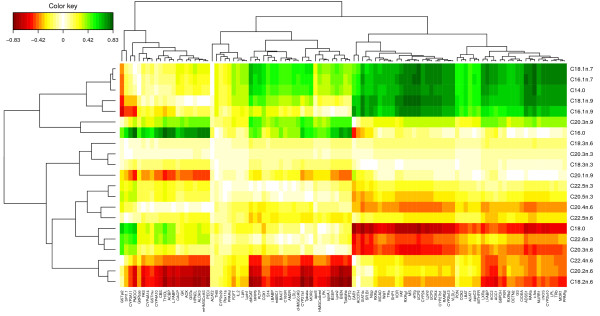
CIM for the Nutrimouse study. CIM for the first two sPLS dimensions (100 genes selected in total). Green (red) indicate high positive (negative) correlation.

CIM for the Nutrimouse study. CIM for the first two sPLS dimensions (100 genes selected in total). Green (red) indicate high positive (negative) correlation.