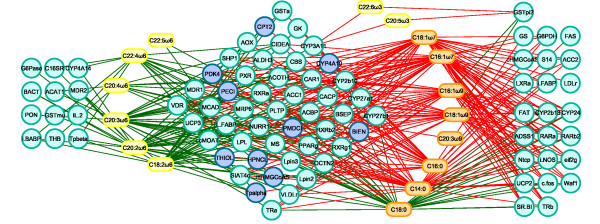
Figure 8.

Relevance Networks for the Nutrimouse study. Relevance Networks generated with Cytoscape based on the proposed estimation of the pair-wise associations between seleted genes and fatty acids. Green and red edges indicate positive and negative correlation respectively.
