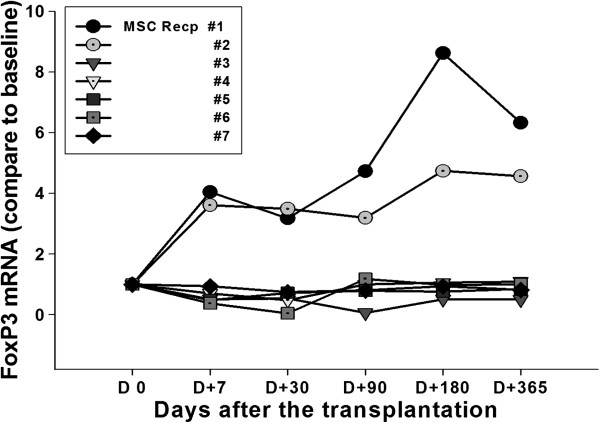
Figure 1.
Level of FoxP3 mRNA. Quantitative real time PCR with recipient urine pellets was performed and analyzed FoxP3 mRNA expression to estimate the induction of regulatory T cells. Following the methods in the Materials & Methods section, Foxp3 mRNA level in the MSC-kidney transplantation patients was measured. Patients’ urine was collected from day 0 and days 7, 30, 90, 180 and 365 after the transplantation. Foxp3 mRNA level was compared to baseline level (= 1).

