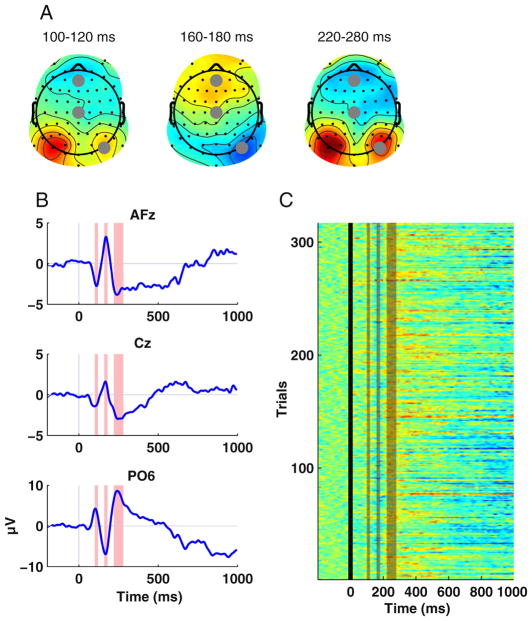
Fig. 1.
Typical visualization of EEG data using data of a single participant from a visual memory study. a Topographies show the spatial distribution of the ERP across all electrodes for time ranges of interest. In this example, time windows corresponding to the first three ERP peaks were chosen. Gray markers indicate the locations of electrodes for which time courses are displayed below. b Time courses of the ERP at three electrodes. Shaded boxes indicate the time ranges used for visualizing topographies. Note that the polarity of ERP components reverses from frontal to posterior electrodes. c A visualization of single-trial EEG data. Each horizontal line represents a single trial of the experiment. Amplitudes are color-coded. Note the variability of the signal across single trials, which is lost in the averaged ERP

