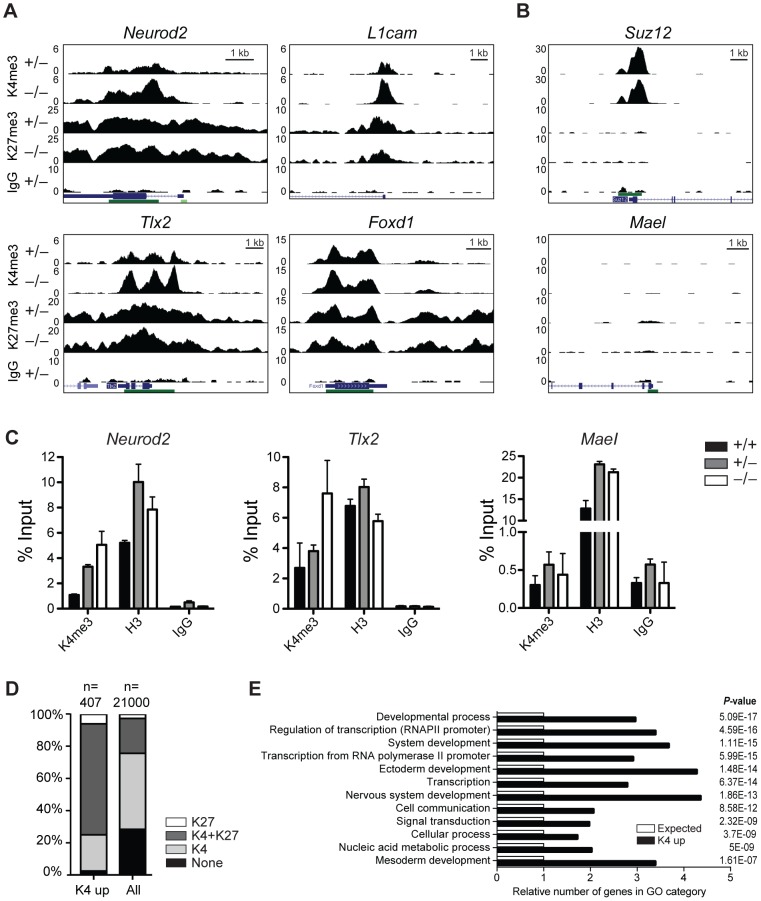
Figure 6. H3K4me3 is increased at bivalent and repressed genes in early Jarid1b embryos.
(A, B) Genome wide profiles of H3K4me3 and H3K27me3 were determined by ChIP-seq in the head region of Jarid1b heterozygous and knockout embryos at E8.5. Representative loci with elevated (A) and unchanged (B) H3K4me3 levels in the knockout are shown. y-axis denotes number of sequence tag reads/million. Schematic presentation of Refseq transcripts is in dark blue, and dark green bars represent CpG islands. (C) ChIP-qPCR for H3K4me3, H3 and IgG in E8.5 embryos. Error bars represent S.D. of three PCR amplifications. (D) Percentage of H3K27me3, H3K4me3/H3K27me3, H3K4me3 and unmodified genes among genes with elevated H3K4me3 levels compared to all genes. (E) Gene ontology analysis of genes with elevated H3K4me3 levels generated using PANTHER. The 12 top scoring categories are shown.

