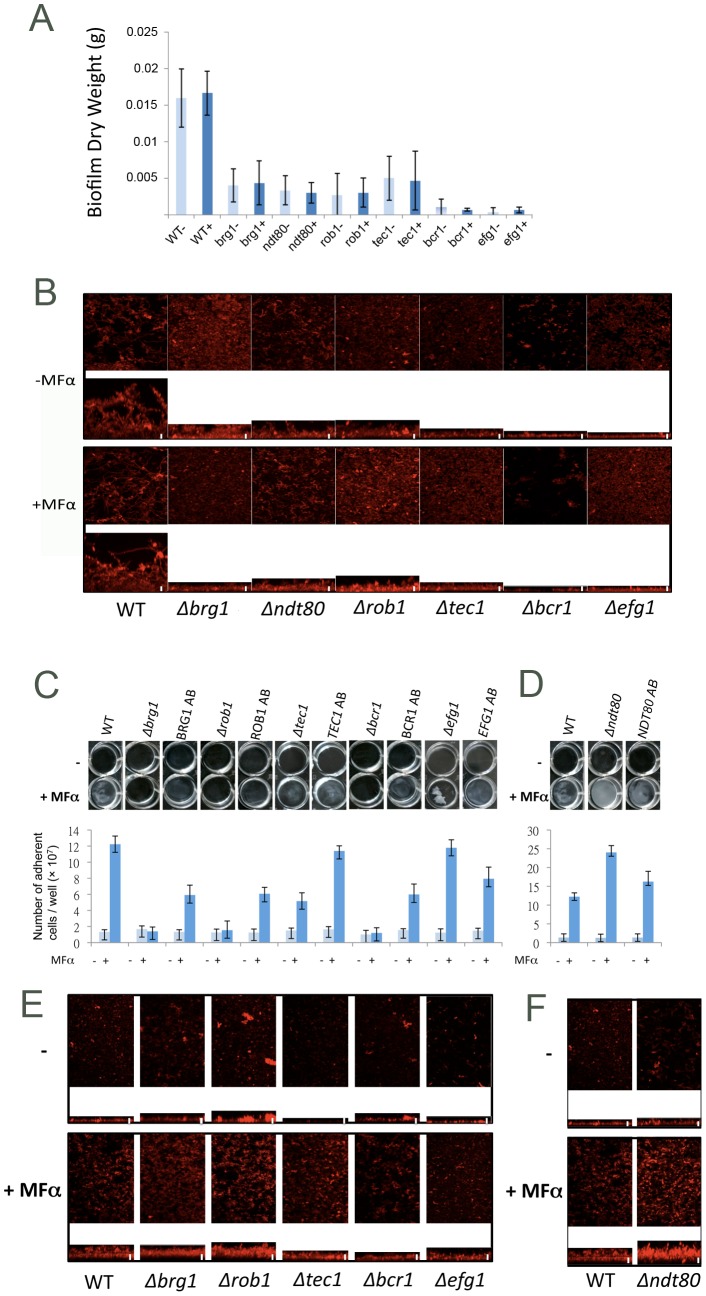
Figure 1. Comparison of the Genetic Regulation of Conventional and Pheromone-Stimulated Biofilms.
Analysis of the role of six biofilm transcription factors, Bcr1, Brg1, Efg1, Ndt80, Rob1, and Tec1, in conventional and pheromone-stimulated biofilm formation, in the presence (+) and absence (−) of α pheromone (MFα). P37005 cells (or mutant derivatives) were grown as conventional biofilms in Spider medium with shaking at 37°C and samples analyzed by (A) biofilm dry weights, and (B) confocal scanning laser microscopy (CSLM). P37005 cells (or mutant derivatives) were grown as pheromone-stimulated biofilms in Lee's medium without shaking at 25°C and samples analyzed by the number of adherent cells (C, D) and by CLSM (E, F). All mutant strains were significantly reduced in conventional biofilm formation (P<0.05). Mutants in Brg1, Rob1, Tec1, and Bcr1 were also significantly reduced in pheromone-stimulated biofilm formation (P<0.01). Values are the mean ± SD from two independent experiments with at least three replicates. AB indicates addback of one copy of the deleted gene to the corresponding mutant. Light blue bars on graphs, no pheromone added. Dark blue bars on graphs, pheromone present. For each CSLM, the top panel represents the top view while the bottom panel represents the side view. Scale bars in CSLM images are 20 µm.

