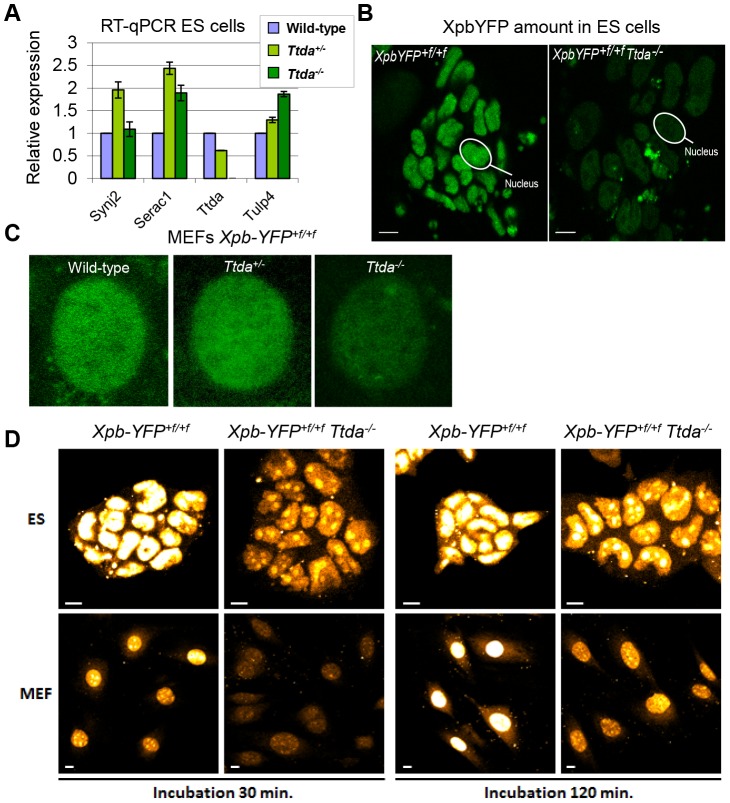
Figure 6. Gene expression levels and TFIIH amount in Ttda−/− ES cells.
(A) Relative expression levels of mRNAs neighboring genes encoding Synaptojamin 2 (Synj2), Serine active site containing 1 (Serac1), Trichothiodystrophy group A (Ttda) and Tubby like protein 4 (Tulp4) in Ttda−/− (n = 2), Ttda+/− (n = 2) and wild-type (n = 2) ES cells as determined by quantitative RT-PCR. The levels were normalized to Gapdh and the error bars indicate SEM between experiments. (B) Representative confocal microscope pictures of XpbYFP+f/+f Ttda−/−, XpbYFP+f/+f Ttda+/− and XpbYFP+f/+f MEFs isolated from 10.5-day-old embryos. (C) Confocal images of ES cells isolated from XpbYFP+f/+f mouse model (left panel) and from XpbYFP+f/+f Ttda−/− mouse (right panel). The green signal is the direct fluorescence of the YFP tagged protein. The white bar measures 10 mm. (D) Confocal images of EU incorporation into ES cells isolated from XpbYFP+f/+f mouse model and from XpbYFP+f/+f Ttda−/− mouse (upper panel) and MEF's isolated from the same mouse models (lower panel). Two EU incubation times have been performed: 30 minutes (left panels) and 120 minutes (right panels). The white bar measures 10 mm.

