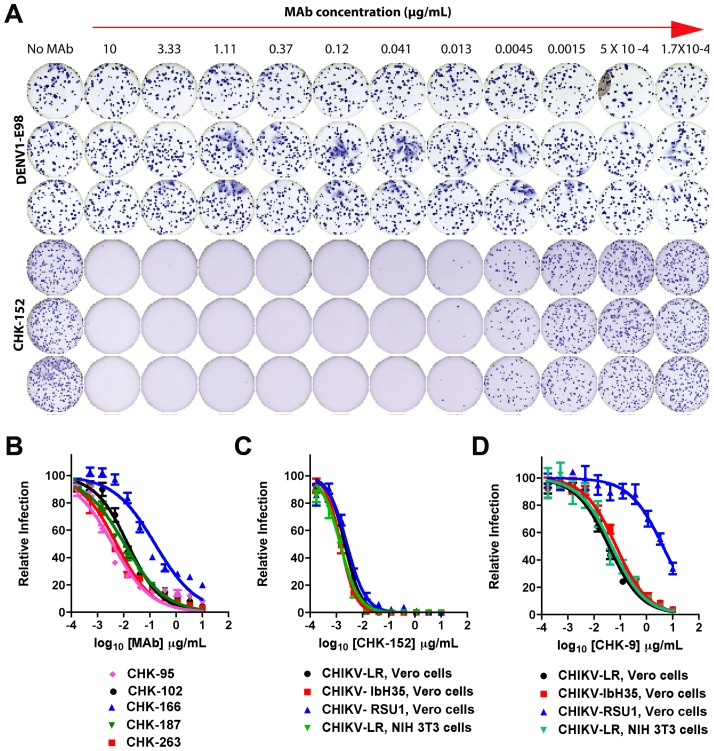
Figure 1. Profile of neutralizing MAbs against CHIKV.
A. Examples of MAb neutralization as judged by a reduction in the number of FFU using the Biospot Macroanalyzer. Rows 2 to 12 going across represent decreasing (3-fold) concentrations of CHK-152 or the negative control DENV1-E98 MAb. Column 1 shows infection in the absence of MAb. B. Increasing concentrations of CHK-95, CHK-102, CHK-166, CHK-187, or CHK-263 were mixed with 100 to 150 FFU of CHIKV-LR for one hour at 37°C and Vero cells were infected. Neutralization was determined by FFU assay. C–D. CHK-152 (C) or CHK-9 (D) was mixed with CHIKV-LR (East, Central and South African genotype), CHIKV-RSUI (Asian genotype), or CHIKV IbH35 (West African genotype) for one hour at 37°C and Vero or NIH 3T3 cells were infected as indicated. Neutralization was determined by FFU assay. Data in this Figure is pooled from three independent experiments performed in duplicate or triplicate. All error bars represent the standard deviations.

