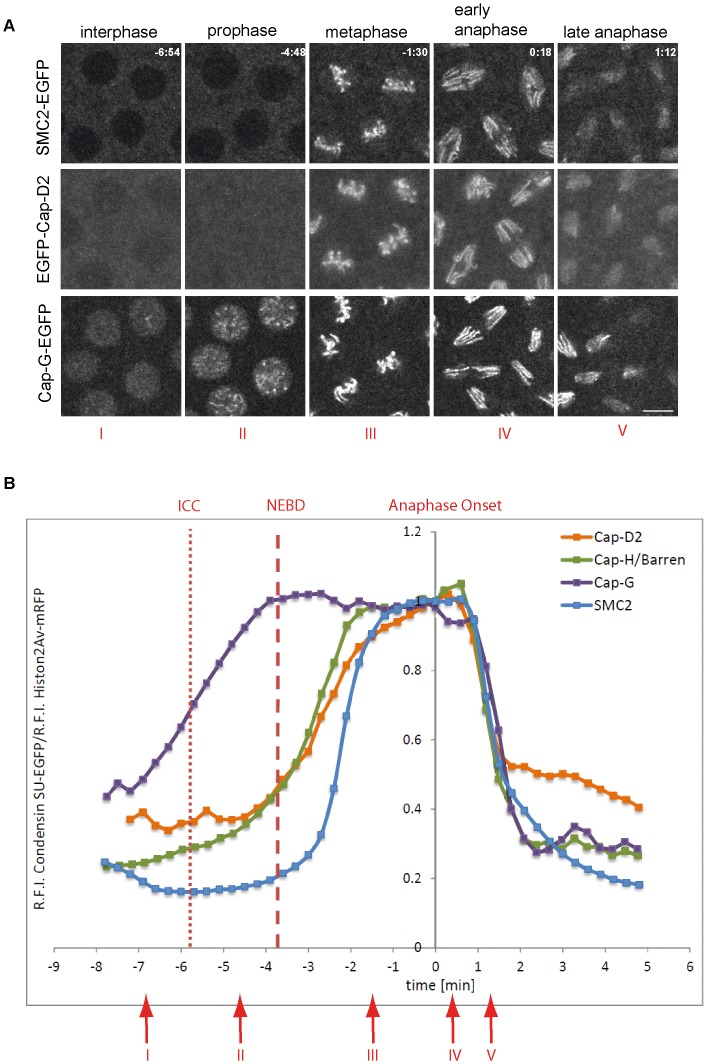
Figure 1. Localization of Drosophila condensin subunits during the cell cycle.
(A) Living embryos expressing gHis2Av-mRFP1 together with gSMC2h-EGFP (upper panel), gEGFP-Cap-D2 (middle panel), or gCap-G-EGFP (lower panel) were imaged while progressing through nuclear cycle 12. Representative images for indicated time points in min are shown (t = 0.0 min, anaphase onset). Note that SMC2h-EGFP and EGFP-Cap-D2 are enriched in the cytoplasm during interphase, while Cap-G-EGFP is nuclear enriched. Scale bar is 5 µm. (B) Fluorescence intensities of EGFP-Cap-D2 (orange), Cap-G-EGFP (purple), and SMC2h-EGFP (blue) were determined for selected nuclei in each frame and are plotted as relative intensities per nucleus. Data series were aligned accordingly to anaphase onset (t0 = last metaphase). Data sets from a total of 15 to 37 nuclei from seven to 15 embryos were aligned. The values for Cap-H/Barren (green) are taken from Oliveira et al., 2007 [28]. The times of initiation of chromatin condensation (ICC) and NEBD are indicated by the dotted and dashed red lines, respectively. The red arrows with the roman type numerals correspond to the images shown in (A).

