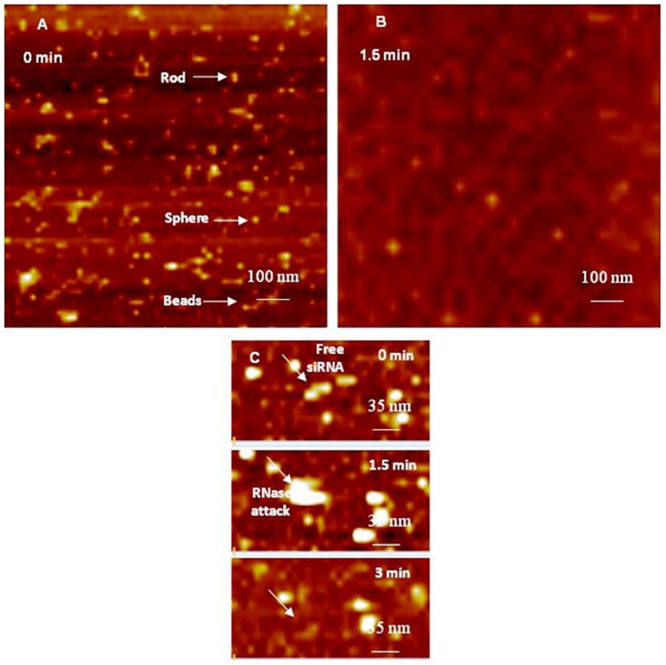
Figure 2. AFM image of free siRNAs before and after attack by RNase enzyme.
(A) AFM image of free anti-GAPDH siRNA dissolved in 1 mM PBS containing 2 mM MgCl2 after adding to the surface of freshly cleaved mica, which shows rod-, sphere-, and bead-like arrangements. (B) AFM image taken 1.5 minutes after adding RNase V1 enzyme, which shows rapid fragmentation of adsorbed siRNA molecules. (C) Time-lapse images showing a single siRNA molecule denoted by the white arrow (t = 0 min), the attack of RNase V1 enzyme on free siRNA molecule (t = 1.5 min), and complete siRNA degradation (t = 3 min). The scale bar in images A and B is 100 nm and the Z scale is 9 nm. The scale bar in image C is 35 nm and Z scale is 7 nm.

