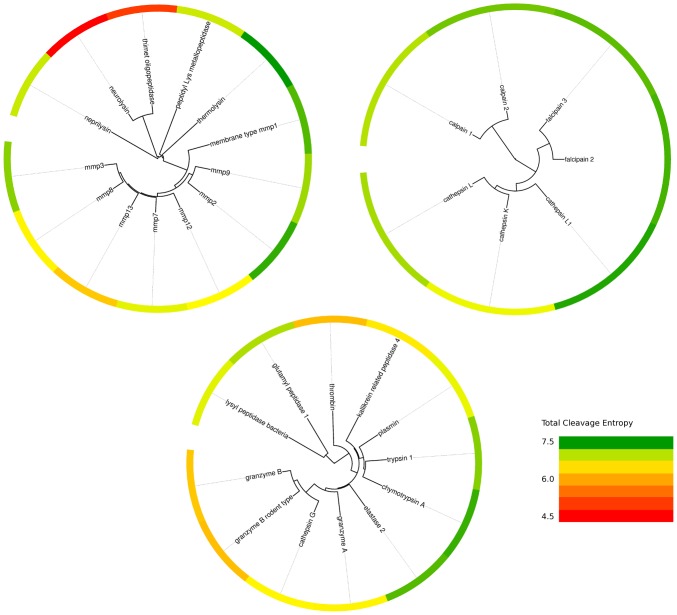
Figure 10. Phylogenetic trees of most prominent protease clans PA, CA and MA.
Scattering of specific and unspecific behavior over respective evolutionary distances is apparent from the color-coded total cleavage entropy in all protease clans. Red fields indicate specific substrate recognition, whereas green fields mark unspecific proteases.

