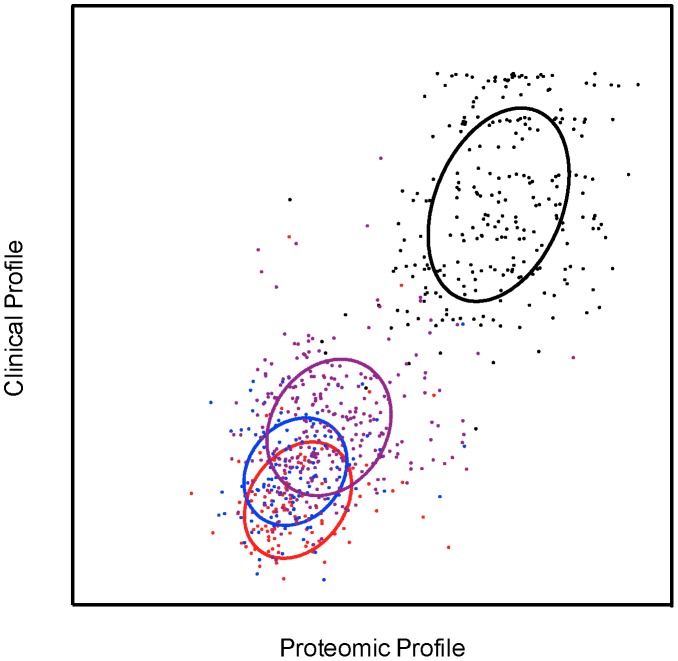
Figure 5. Sparse canonical correlation between proteomics and clinical profiles in the childhood severe malaria dataset.
The x-axis gives the score in the proteomics profile while the y-axis gives the score in the clinical profile. Data points labeled based on the four diagnostic classes Community Controls (black), Uncomplicated Malaria (purple), Severe Malaria Anaemia (blue) and Cerebral Malaria (red). Ellipses denote the mean and covariance of the class clusters.

