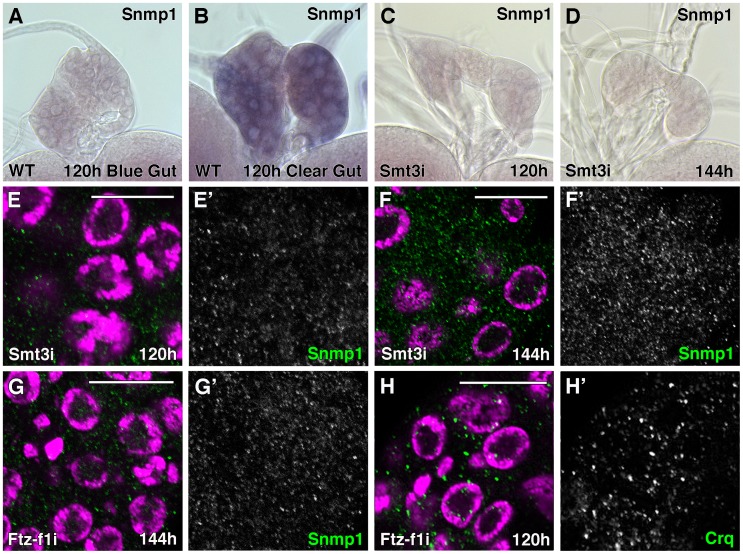
Figure 3. Expression of SR-BIs is reduced in smt3i and ftz-f1i PG cells.
(A–D) Micrographs of Snmp1 mRNA in situ hybridization in PGs from WT (A, B) or phm-Gal4>UAS-smt3 RNAi (smt3i) larvae (C, D) at the indicated hours AEL. Snmp1 mRNA is upregulated in WT clear-gut larvae (B, compare with A). However, no expression is visible in smt3i PGs (C, D). All the in situ reactions were stopped at the same time and pictures were taken at the same magnification. (E–H) Single plane confocal micrographs taken under the same intensity settings. Nuclei are marked with DAPI (purple) and Snmp1 (E–G) or Crq (H) are shown in green. (E, F) smt3i PG cells have basal but reduced levels of Snmp1 at 120 hours AEL larvae (compare to WT in Figure 2B) but they do not upregulate SR-BIs expression at 120–144 hours AEL larvae. (G, H) ftz-f1i PG cells show Snmp1 (G) or Crq (H) expression highly reduced compared to Figure 2C or 2E, respectively. (E′–H′) Single green channels are presented in black and white. Scale bars indicate 20 µm.

