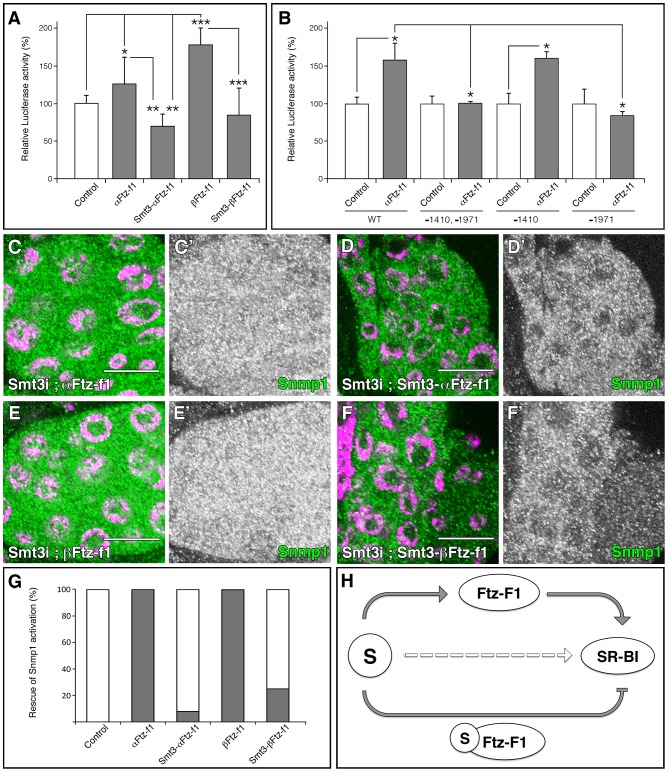
Figure 8. SUMOylation of Ftz-f1 modulates Snmp1 expression.
(A, B) Graphical representations of the luciferase activity from WT Snmp1-Luc (A) or the indicated mutant vectors (B) cotransfected in S2R+ Drosophila cells with plasmids expressing the indicated proteins. As control, empty pUASTattB vector was used. A single asterisk indicates p<0.05, two asterisks p<0.001 and three asterisks p<10−6. (C–F) Single plane confocal micrographs taken under the same intensity settings showing Snmp1 staining (green) in PGs of phm-Gal4>UAS-smt3i;UAS-αFtz-f1 (C), phm-Gal4>UAS-smt3i;UAS-Smt3-αFtz-f1 (D), phm-Gal4>UAS-smt3i;UAS-βFtz-f1 (E) or phm-Gal4>UAS-smt3i;UAS-Smt3-βFtz-f1 (F). Nuclei are labelled with DAPI (purple). (C′–F′) Single green channels are shown in black and white. Scale bars indicate 20 µm. (G) Graphical representation of the proportion of PGs that show Snmp1 expression in an smt3i background (grey bars). White bars indicate no Snmp1 expression rescue. The transgenes used for the rescue experiments are indicated. (H) Schematic summary of the results, where S means Smt3. Grey arrows indicate the requirement of SUMOylation for Ftz-f1 and SR-BI expression, and the regulation of SR-BI by Ftz-f1 or Smt3-Ftz-f1. Broken open arrow indicates hypothesized posttranslational modification of Scavengers by Smt3.

