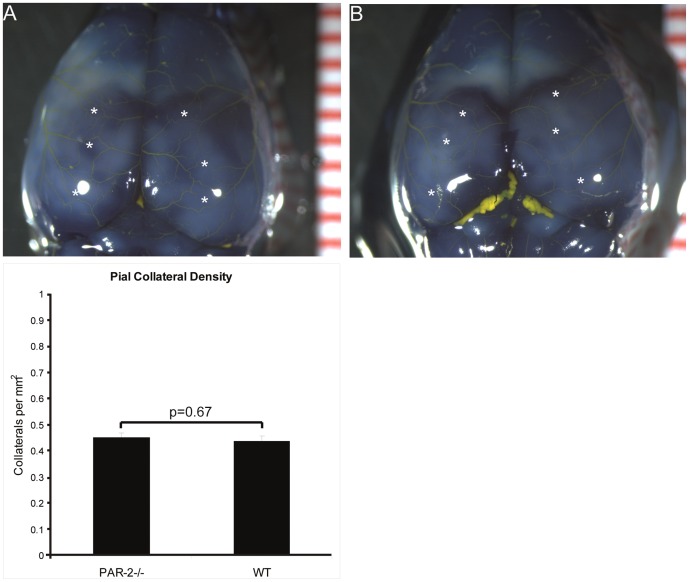
Figure 3. Representative images of the pial circulation in PAR2-/- (A) and WT mice (B).
To illustrate, several, but not all collateral arterioles have been indicated with white asterisks. Following exsanguination and maximal dilation of the dorsal cerebral circulation, Microfil™ was used as a casting agent, after which the whole brain was fixated in 4% PFA and subsequently stained in Evans Blue for contrast. (C) Pial collateral density was calculated in PAR2-/- and WT mice by dividing the sum of collaterals between anterior, middle and posterior cerebral arteries by the surface area of the cerebral hemispheres. Areas were excluded when they were damaged, had poor filling with Microfil™, or were otherwise uncountable. All values are presented as the mean ± SEM.

