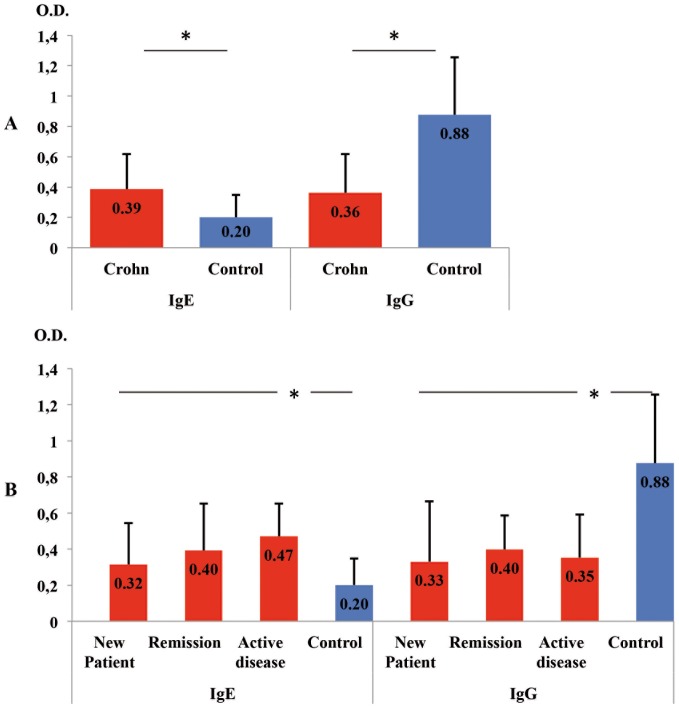
Figure 1. Anti-Encephalitozon antibody levels measured by ELISA (IgE and IgG).
A: Crohn`s disease (N = 36) vs Control group (N = 36). B: Clinical scenarios of Crohn's disease, New patient (N = 13), Remission (N = 13), and Active disease (N = 10) vs Control group. Immunoglobulins are expressed in means of Optical Density (O.D.) values and T bars denote standard deviation. * P<0.001.

