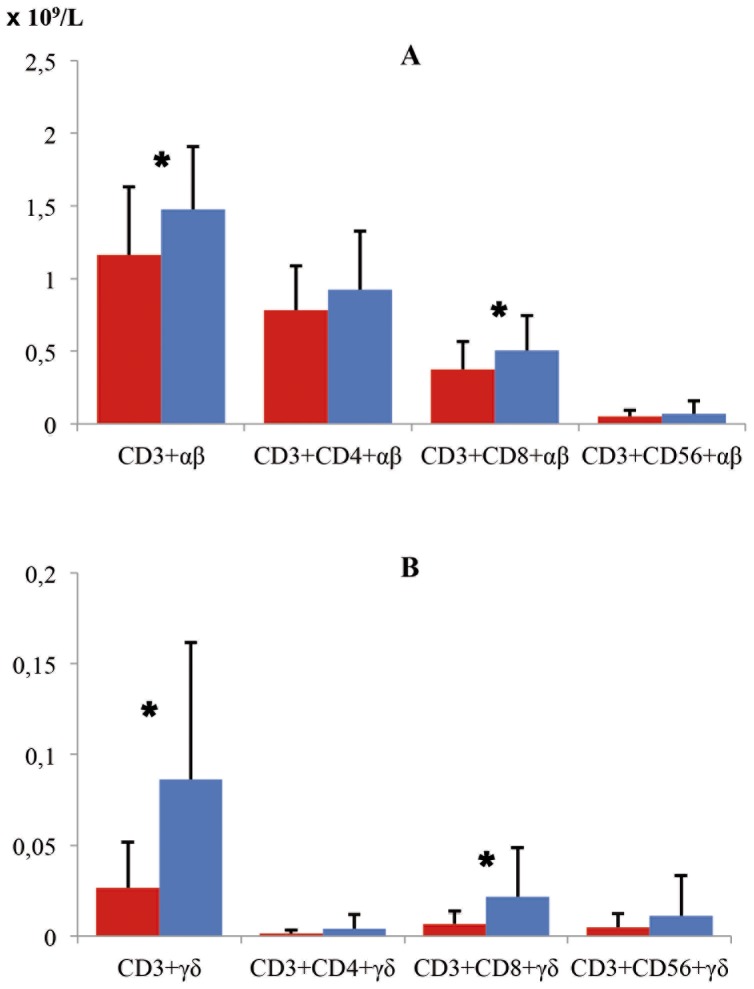
Figure 3. Values of T lymphocyte subsets according to type of receptor αβ (A) and γδ (B) in CD patients and Control Group.
CD patients (red bars) and control groups (blue bars). Significant differences (*) were observed in the case of CD3+αβ (P = 0.006), CD3+CD8+αβ (P = 0.018), CD3+γδ (P<0.001) and CD3+CD8+γδ (P = 0.003). The deficit of T lymphocytes in patients with CD with respect to the control group was more intense when γδ T cells were studied.

