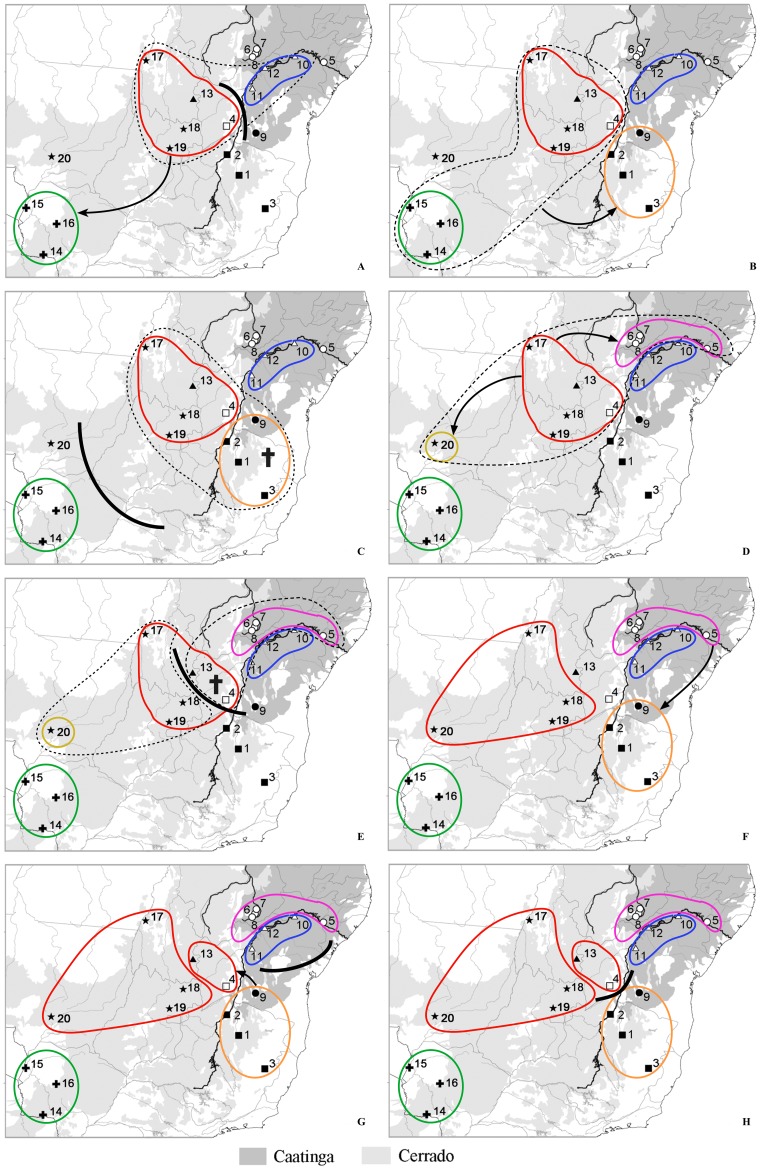
Figure 5. Biogeographic hypotheses of colonization history of Thichomys based on S-DIVA analysis using RASP (A–H).
Solid line polygons represent the different ancestral populations; dotted line polygons represent past connected populations; solid lines represent vicariant events; crosses represent extinctions; arrows represent dispersions. Sites of collection are the same as Figure 2 and Table S1 and they are represented here for clarity.

