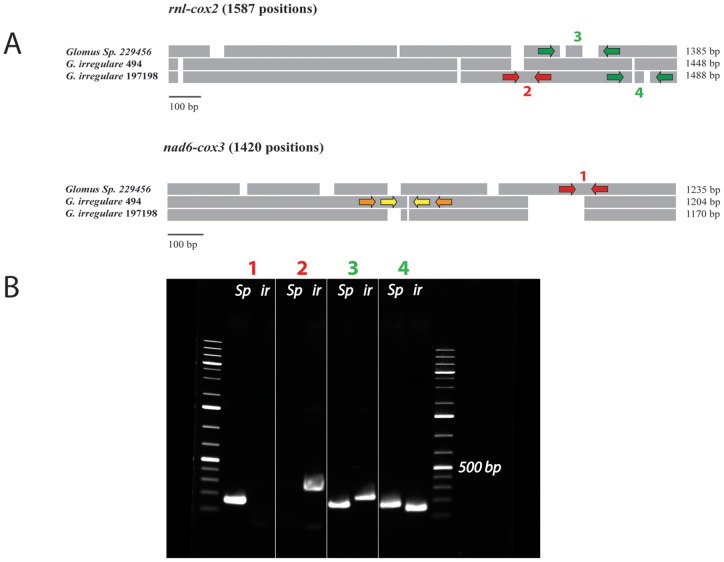
Figure 3. A) Schematic alignment representation of two mitochondrial intergenic regions (rnl-cox2 and cox3-nad6) showing the presence of numerous insertions and deletions (indels).
The red arrows indicate the approximate position of the PCR primers that yield strain-specific markers, while the green arrows indicate the position of PCR primers that produce a size-specific marker. The yellow and orange arrows indicate potential regions to design, respectively, specific and size-specific markers in G. irregulare 494. B) Agarose gel electrophoresis figure showing the PCR results of the proposed markers on Glomus sp. 229456 (Gs) and G. irregulare DAOM197198 (Gi) respectively for each marker. Marker 1 shows the Glomus sp. specific amplification (156 bp), while marker 2 shows the G. irregulare 197198 specific marker (263 bp). The size-specific marker 3 yield a length of 160 bp for Glomus sp. and 226 bp for G. irregulare 197198. Finally, the size-specific marker 4 yield a length of 159 bp for Glomus sp. and 131 bp for G. irregulare 197198.

