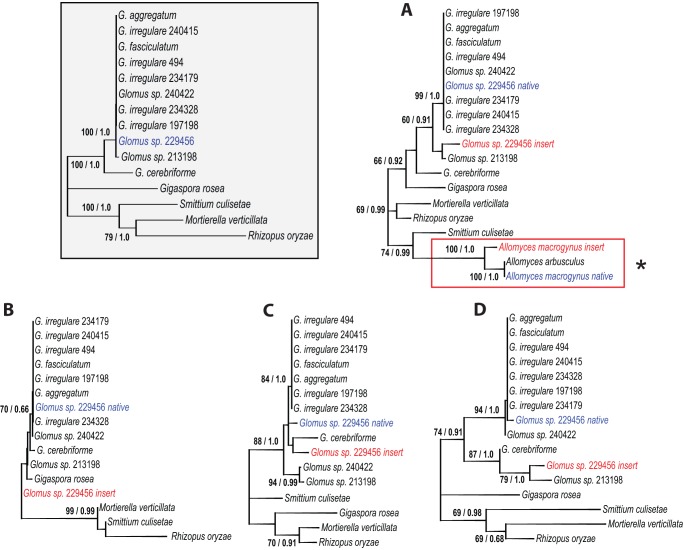
Figure 5. Unrooted maximum likelihood trees obtained with the GTR+G model (5 distinct gamma categories).
The first number at branches indicates ML bootstrap values with 1000 bootstrap replicates and the second number indicates posterior probability values of a MrBayes analysis with four independant chains. Bayesian inference predict similar trees (not shown). The concatenated tree of the atp6, atp9, cox2 and nad3 ‘core’ genes (without the duplicated C*-terminal portion) (1489 alignment positions) of selected AMF representatives (grayscale boxed) are compared with those of the atp6 (298 alignment positions), where the red box with the asterisk point out to the reference Allomyces spp. HGT event (Figure 4) (A), atp9 (51 alignment positions) (B), cox2 (106 alignment positions) (C) and nad3 (120 alignment positions) (D) C*-terminals. The Glomus sp. native C*-terminals are in blue, while the inserted C-terminals are in red.

